To demonstrate how this might be used for a direct marketing organization, we'll walk through a workflow that might make sense from a business perspective, from data input to reporting.
Data Integration
Pentaho's Data Integration module allows users to extract data from a number of data sources, transform it so that it is in a standardized format, and load this information into a central database to make it possible for future analysis.
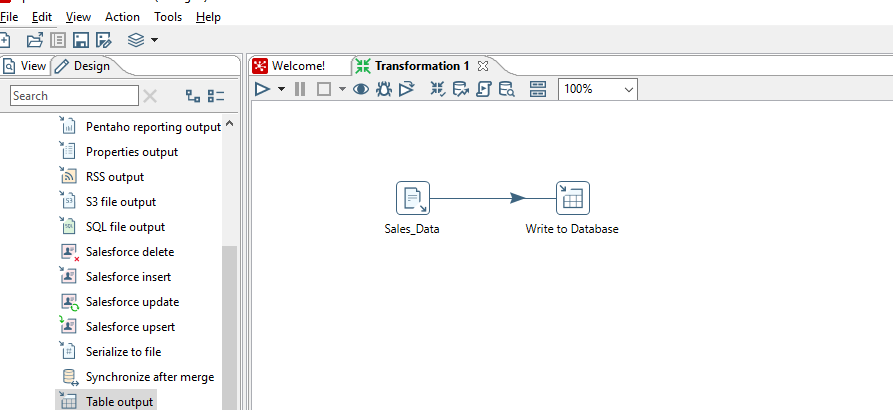
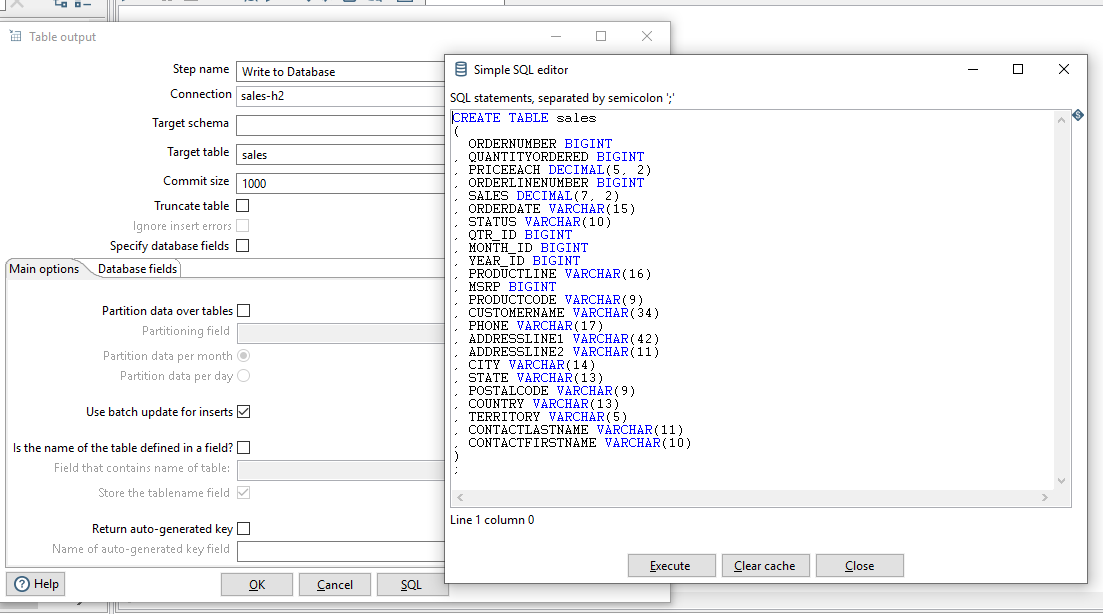
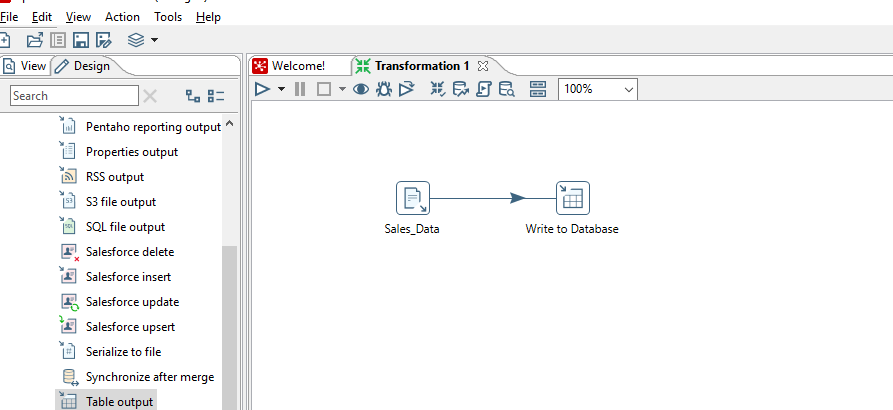
Loading customer data from a CSV file is accomplished by dragging a data input node onto the canvas and loading the file. The data can be previewed, and then imported. Storing this into a database simply requires dragging and dropping a “table output” node, specifying a target database, and connecting the two nodes. By defining a table in the database, this will automatically take any of the information from the input file and generate a SQL query:
The transformation created will consist of only two nodes and a connection.
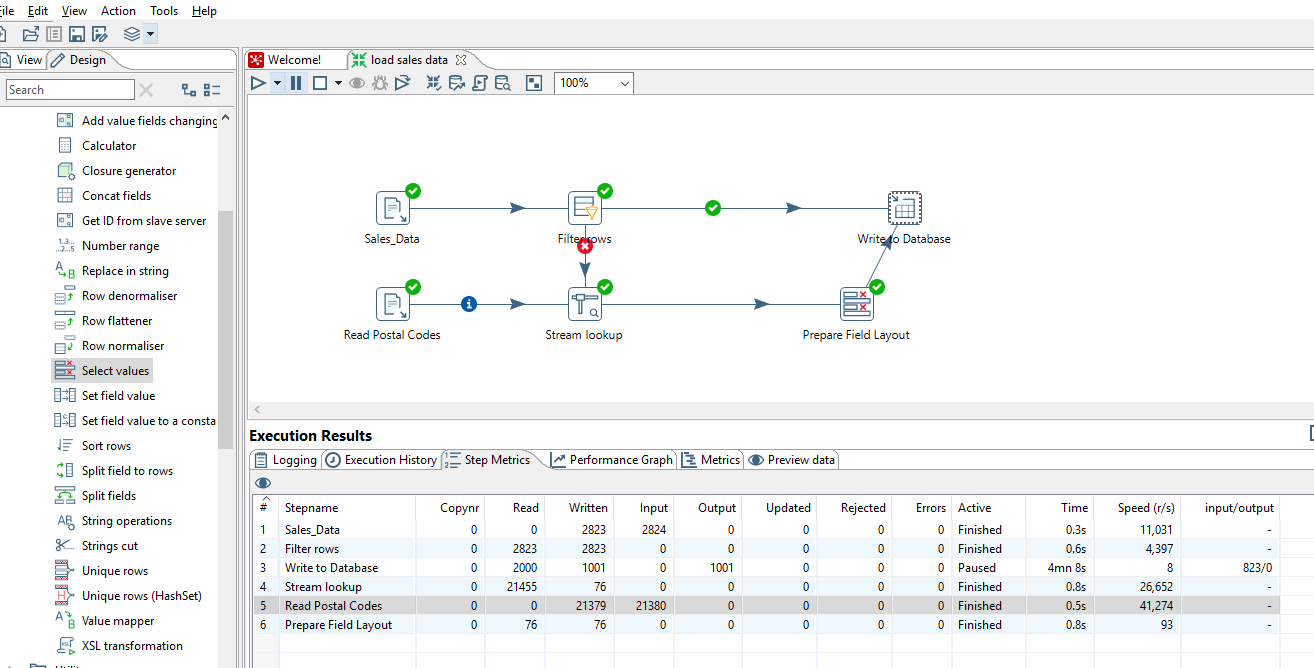
Typically with customer contact data, it's quite common that a significant amount of necessary data may be missing from the original file. It is relatively simple to create a basic workflow which will examine the data from the original file and identify those fields that are missing, such as postal zip codes, and combine them with a different file for lookup purposes.
The workflow below shows connecting two files: the first one is the original csv file, and a simple conditional check for existence of a postal code. If the condition succeeds, it writes those rows to the database. For those that are missing this data, it checks a second table which provides a basic mapping table showing association of address data with postal codes. We can check to see if those postal codes can be determined; then these two pieces of data can be merged and separately loaded into the database.
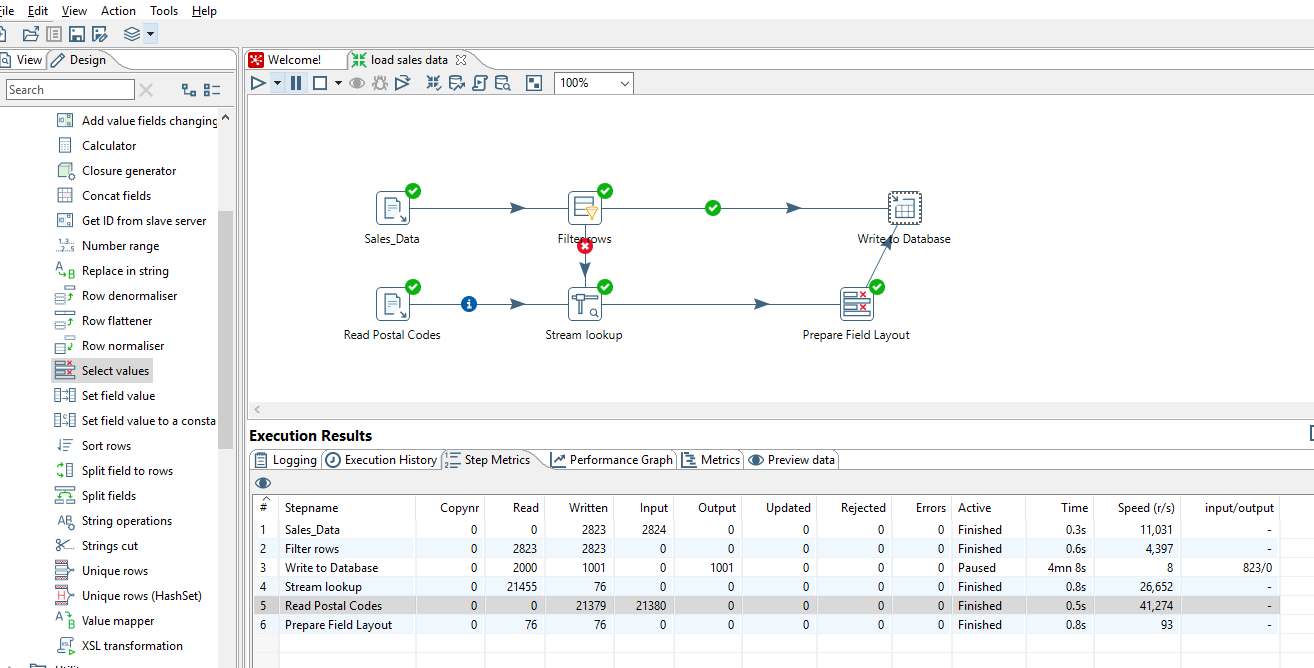
While this is a relatively simple demonstration, as it uses two similar data source types, Pentaho integrates well with numerous sources, ranging from the aforementioned CSV files as well as multiple relational and non-relational databases, and APIs. It boasts a simple interface for performing some more complicated functions, such as enabling users to be able to filter large amounts of parallel data, with some built-in Hadoop mapreduce functionality.
Business Analytics
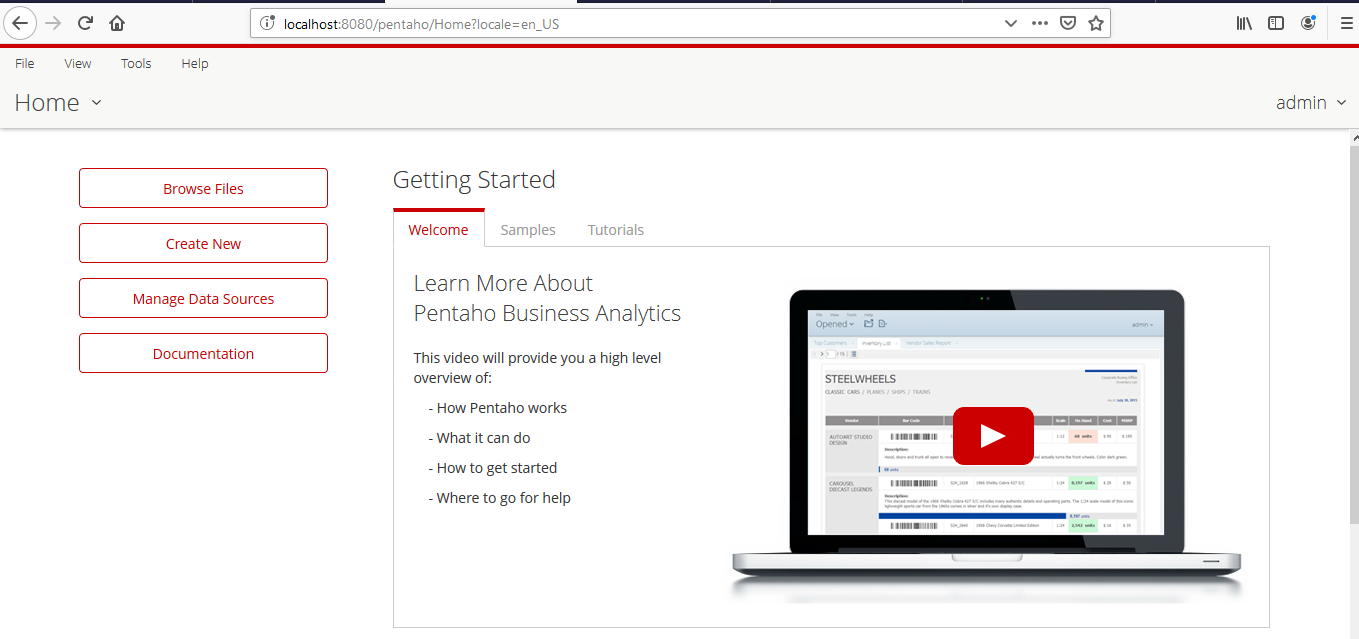
In order to gain solid business intelligence out of marketing or sales data, Pentaho provides an easy to use Business Analytics platform.
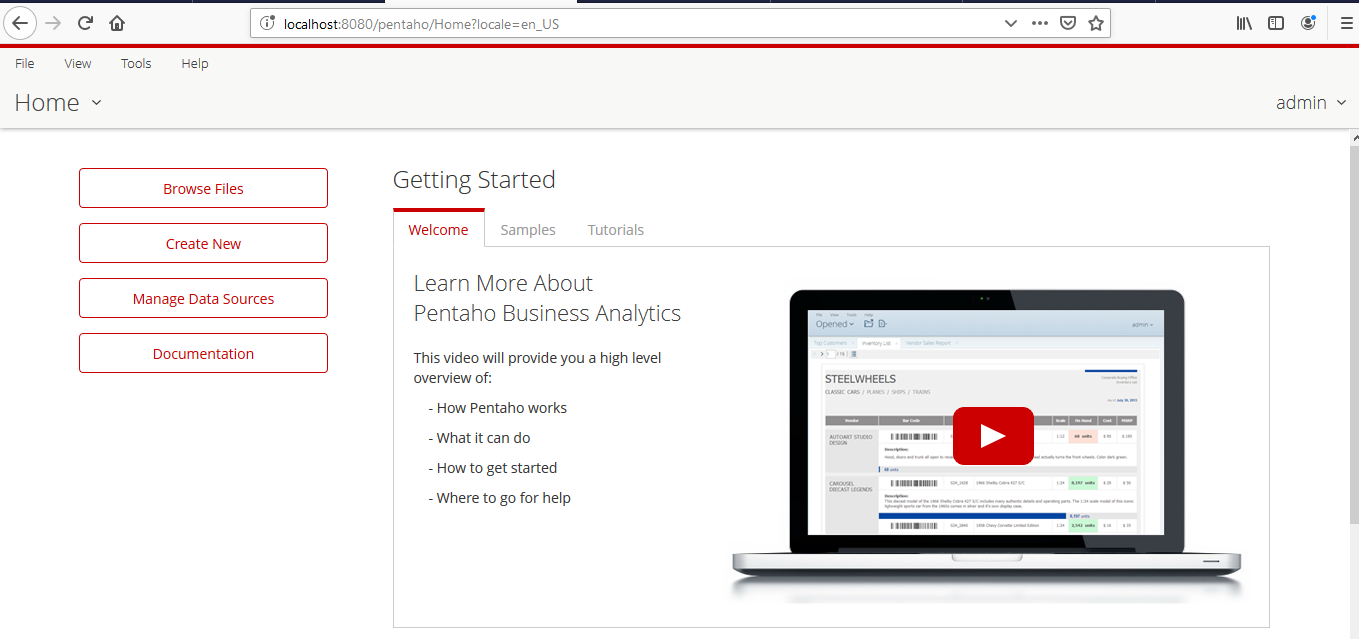
This tool can be used either directly with data transformed and loaded by the Data Integration module, or with independent datasets. The interface for this business intelligence module is designed specifically with business users in mind; very little technical knowledge is required beyond standard business analysis.
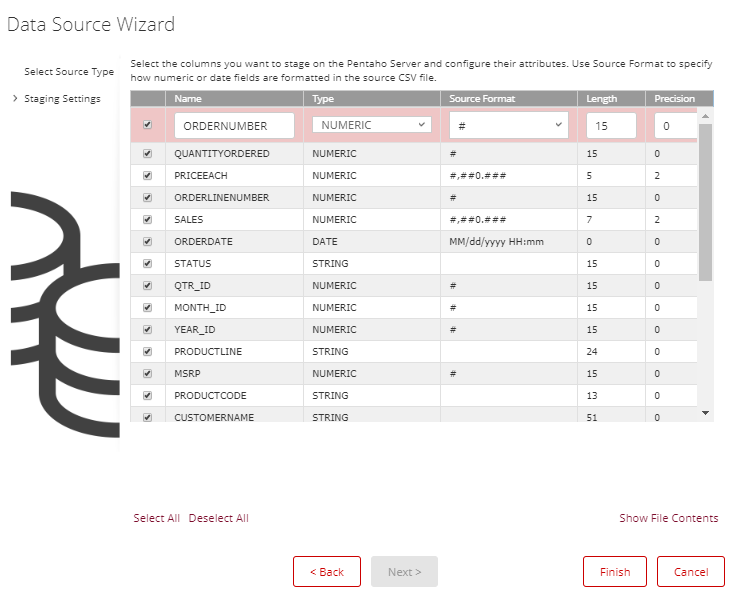
Loading data from a CSV file or from a SQL query is driven by wizards, which allow previewing data, and also allows managing data types and field formatting on the fly:
Data Analysis
Pentaho's Business Analytics tool provides some helpful graphical analysis tools. For instance, if working with multi-dimensional datasets, creating interactive tables is no more complicated than creating pivot tables in spreadsheet software. It provides functionality which allows drilling down to individual data segments, such as sales per year and region:
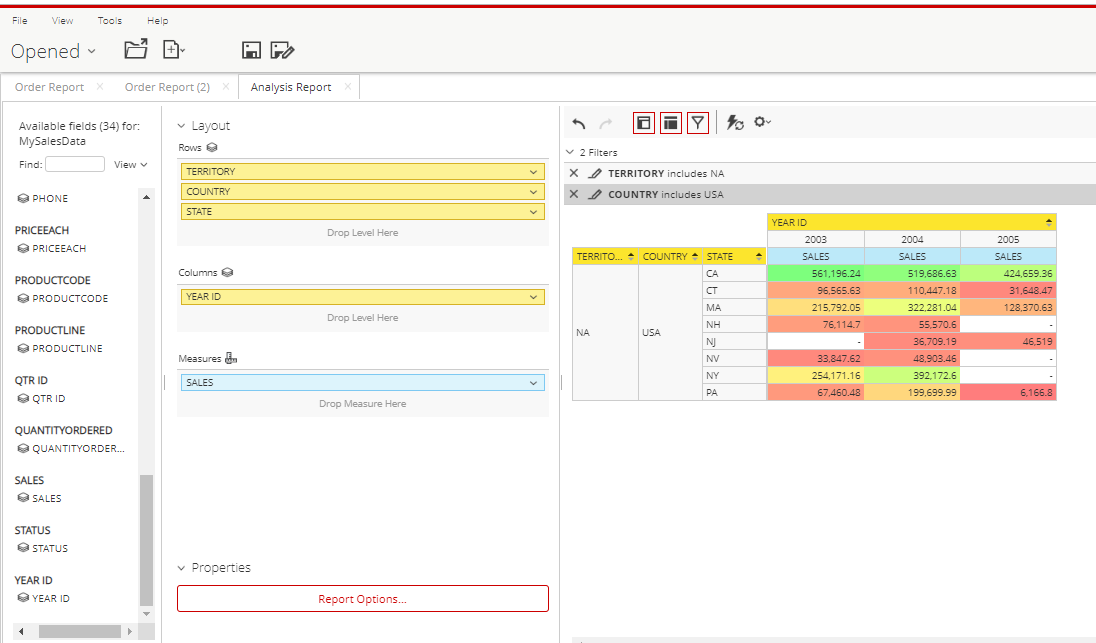
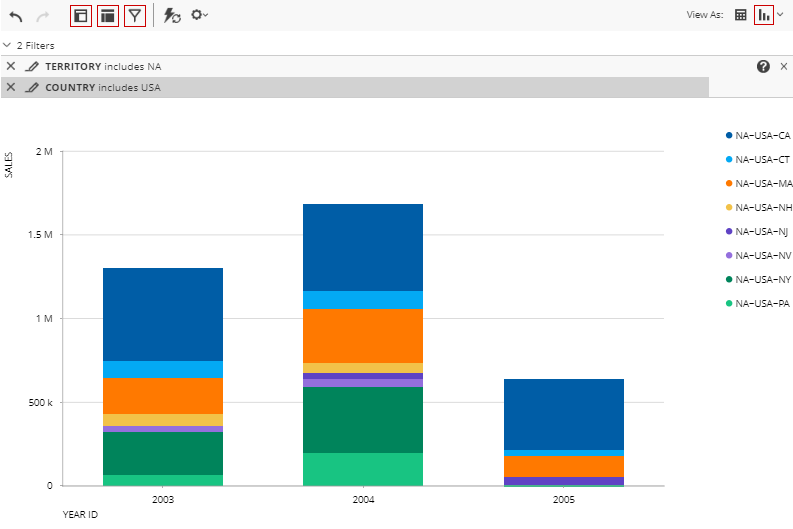
The resulting summarized data can easily be converted into a graph with only a few clicks.
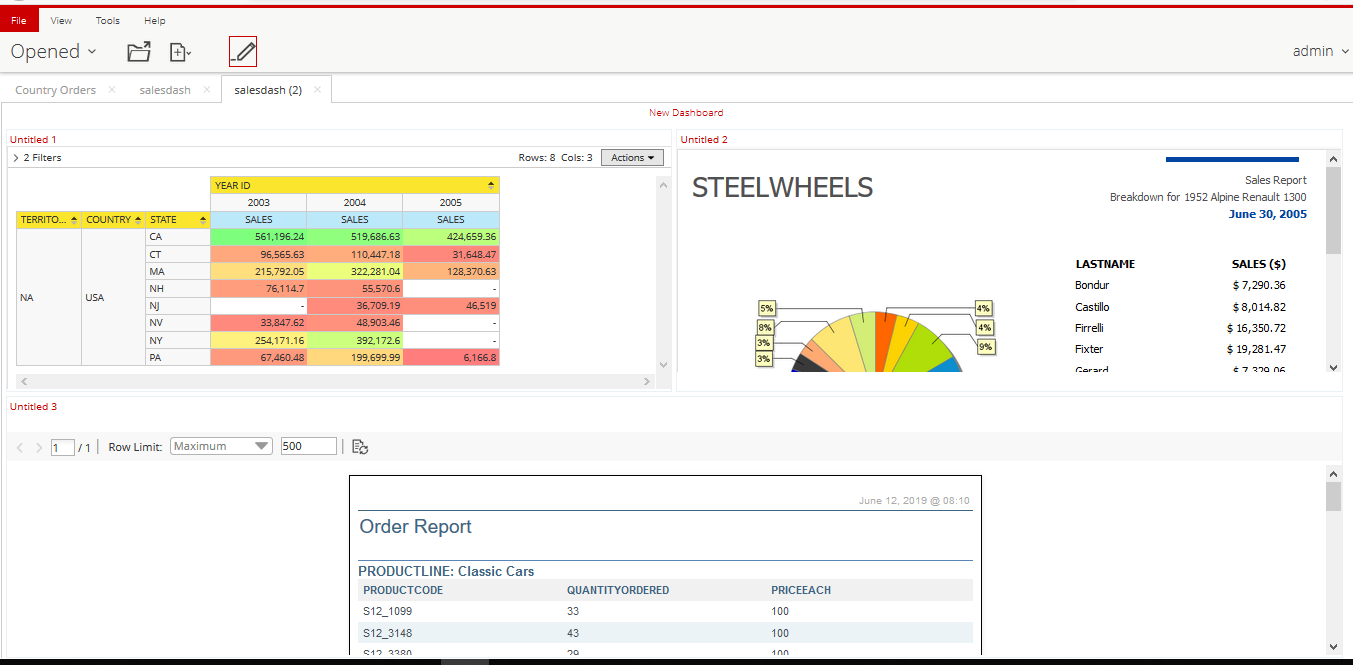
Each of these individual reports, can be saved as widgets and can be used to quickly create interactive dashboards:
Scheduling
If you data is being regularly updated into a database through a datastream, it's easy to trigger queries off of a schedule, keeping dashboards up to date based on user-specified criteria.


