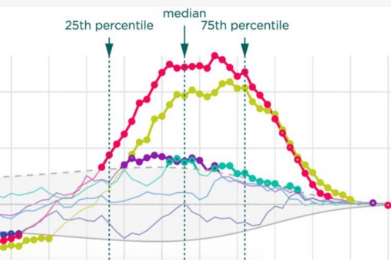
Data Visualization Engineers focus on the design and development of reporting solutions that best convey the results to their clients. They help identify patterns, trends and changes in the data that may be otherwise hidden or not readily apparent by stand-alone numbers and text.
That’s why they walk the line between the technical and the creative. Technically, they must be able to understand what the data reveals in comparison to the client’s goals before they’re able to create a visual representation of it; and in order to translate the facts and figures into a valuable insight, a creative focus becomes crucial. For example, a simple graph may show peaks and valleys, but it may not highlight some of the less dramatic nuances. Those finer details may be essential to understanding how the highs and lows develop, and an important focus of the report.
Creatively, Data Visualization Engineers need to know how their clients will best respond to the visual analysis. They must be able to interpret and express what the data means, know what colors and shapes to use, and be able to compile the information in such a way that viewers instinctively can interpret what it all means when compiled.
Python
Python can help Data Visualization Engineers program and transform data that can communicate the results of the query set.
SAS
SAS remains in use and continues to see strong support overall within the various data analysis fields.
SQL
SQL (structured query language) is the foundation of complex queries because most big data systems use it, along with additional proprietary extensions for more customized use. Even so, the standard SQL commands such as "Select," "Insert," "Update," "Delete," "Create" and "Drop" can still be used to accomplish most tasks – a universal language to master.
NoSQL
Big data calls for big scaling capabilities, and so Data Visualization Engineers should be familiar with NoSQL software such as MongoDB or HBase. These systems work quickly with large volumes of data and can scale accordingly for a more customized approach.
Big Data Computation Networks
Apache Hadoop, Hive and Pig are not essential, but can certainly help round out Data Visualization Engineers understanding of how to gather and select the right data for the query at hand.
The bigger the data, the slower the process, so speed is key. Apache Spark is also popular because it’s faster than Hadoop – a boon when running extremely complex algorithms. Familiarity with cloud-based tools can also be a great assistance. Amazon S3 is one of the more popular ones.
Data Visualization Tools
Descriptive Analytics requires Data Visualization Engineers to communicate their findings in an illustrative way; in order to do so, they need to be familiar with the wide assortment of tools that are at their disposal.
D3.js is at the top of the list for Data Visualization Engineers, because it allows them to showcase data findings from HTML, SVG, and CSS and it provides all of the selected browser functionality without having to adhere to its framework. D3’s data-driven approach combines with powerful visualization components, allowing Data Visualization Engineers to bind arbitrary data to a Document Object Model (DOM), and then apply the indicated data transformations to the document.
Tableau is an essential software package that can present the data and showcase the derived insights. It provides a wide array of tools that allow Data Analysts to drill down further and see the results in a variety of visual formats.
ggplot2 allows Data Analysts to plot trends on a graph with unique color-coding to help distinguish between key points. The findings can then be processed directly as a PDF or object that can be easily disseminated to shareholders.
FusionCharts is a JavaScript-based formatting software that charts both web and mobile platform data into three-dimensional graphs. According to New Gen Apps, more than 80% of Fortune 500 companies use it.
Illustrator shouldn’t be overlooked, either, as it can be a great assist for Data Visualization Engineers. It’s a vector-based, graphic software that is used to develop images. Its versatility is what makes it so valuable across many business applications.


