


Tableau
4
The modern company has numerous lines of business (LOB). Those LOBs might include Marketing, Sales, HR, Finance, Product Development, Inventory & Procurement, Customer Service, Inventory and so on. Each LOB has its own managers, its own goals and its own system for using data.
Common sources for internal (first-part) data include the company’s customer relationship management (CRM), enterprise resource planning (ERP), advertising platforms, sensors, accounting, marketing automation and more. In most companies, each LOB’s data is siloed within that department.
If an executive or manager needs to know how a specific operation or campaign is performing, they request a report. That report might take days to create, and when delivered it will be historical in nature, because none of the data systems have the capacity to report data in real time.
Until recently, there was no single resource that provided a comprehensive and accurate view of how the company was doing in real time.
Today, that’s what Business Intelligence (BI) does.
According to Gartner, Business Intelligence (BI) is “an umbrella term that includes the applications, infrastructure and tools, and best practices that enable access to and analysis of information to improve and optimize decisions and performance.”
Translating that conceptual definition into a task model, BI turns a company’s raw data into actionable information by:
The ability to report data across all LOBs makes BI an excellent tool for collaboration. Different dashboards that visualize the data graphically are created as needed, so each LOB sees the data from the perspective of what is most important to them.
For example, a COO’s dashboard might show how each of the company’s LOBs is doing — and have the ability to drill down into each LOB for specific information and insights — while a sales manager might see only sales and inventory visualizations on their dashboard.
While any BI platform should be able to perform all of the four tasks listed above, more advanced BI platforms also incorporate Business Analysis. You’ll find more on how BI and BA work together below.
Business Intelligence is a broad term that was coined the mid-19th century. It was first used to describe a network of information merchants a banker developed throughout much of Europe. That network provided information to him faster than his competitors could get it, which gave him a tremendous competitive advantage.
An IBM researcher named Hans Peter Luhn used the term in a 1989 IBM Journal article titled “A Business Intelligence System.” Luhn’s idea of Business Intelligence was an automated system for “selective dissemination” of documents to “action points” in order to help the organization complete important tasks.
Within a few years of Luhn’s article, the term Business Intelligence was being used across industries. Just as it did in the 19th century, BI gives the companies that use it a tremendous competitive advantage.
By connecting all data sources in a single platform and making it easy to visualize and understand, BI enables organizations to:
BI doesn’t just present raw data, it makes it actionable. It shows you — for the business as a whole as well as for every individual unit —easy-to-understand visual depictions of Key Performance Indicators (KPI) on dashboards customized to the needs of the user. If the company isn’t meeting its goals, it shows you where the shortfalls are. With BI you see the information in real time or near-real time, as opposed to having to wait days (or longer) for a report to be created by staff.
Instead of having to make gut-hunches about what’s working in your business and what’s not based on reports from data that is days or weeks old, BI creates visualizations of the unbiased data and presents those visualizations on dashboards. BI uses descriptive analytics to visually summarize historic and current data. It also uses diagnostic analytics to determine the source of any problems reported by descriptive analytics. This enables your organization, from top to bottom, to start making decisions based on accurate, unbiased data.
By bringing together data from numerous sources in the BI platform, data analysts can correlate data from different departments. This may reveal previously-hidden insights. For example, sales overview might show that a particular product is meeting its sales goals. A single report of how that product is performing in each channel may reveal that it is a big hit in one channel and performing way below its goals in three others. Then, a close look at how the product is offered in each channel may present an actionable insight that will help lift sales in channels where it is underperforming. For a company with hundreds or thousands of products, it likely would take a series of happy accidents to reveal these insights.
In addition to using first-party data, BI allows a business to add industry and competitor data. By creating benchmarks with this third-party data, a business can measure its performance against how the overall industry is doing as well as how they are doing compared to specific competitors. Benchmarks put company progress in perspective. Sometimes, what looks like a good month is actually lagging, while what seems like a poor month could just be a reflection of a down market.
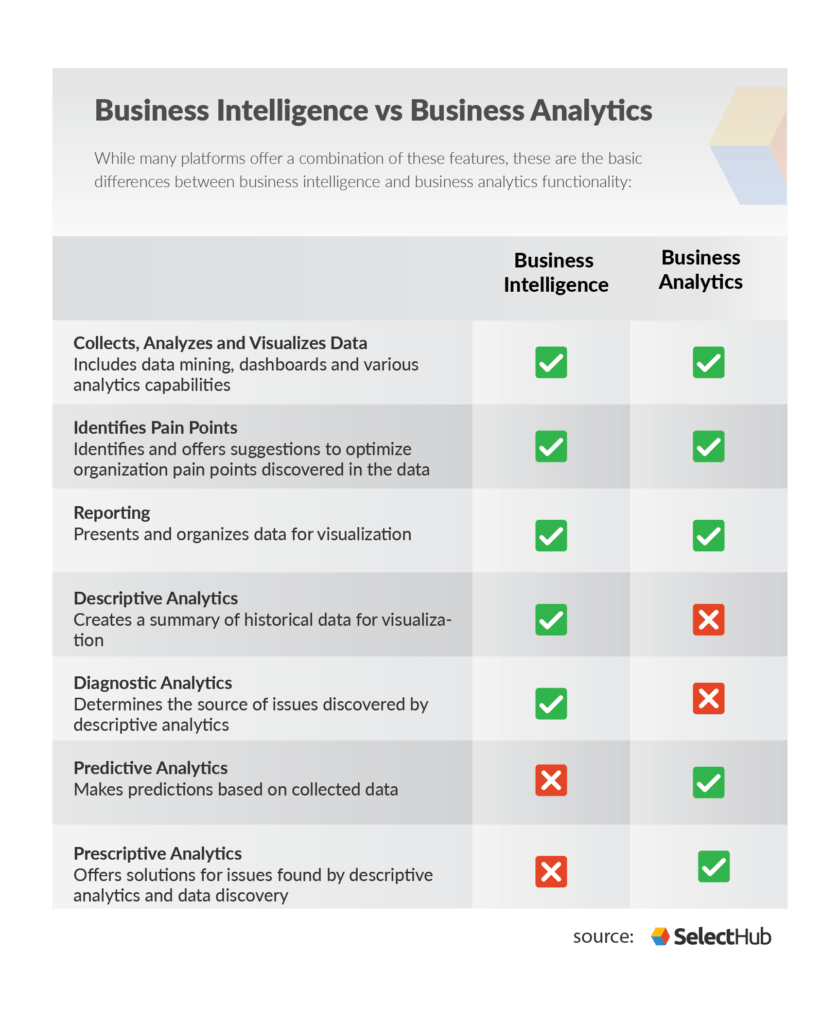
While these features of BI are critically important to an organization, they only help you see what is happening in your organization and what has happened in the past. For analytics that shows you how to improve future performance, you need a BI platform that includes Business Analysis (BA).
Business Analysis (BA) is a subset of Business Intelligence (BI). While BI gives you the descriptive analytics and diagnostic analytics to see how your business is doing today, BA also gives you predictive analytics and prescriptive analytics to help you improve future outcomes.
Data scientists and machine learning developers use predictive analytics to forecast future outcomes. To do that, they mine historic data to find patterns and trends among the records and implement algorithms to build models of future possibilities. These models also help them find potential risks and previously unrecognized opportunities.
Predictive analytics constructs many models in a very short timeframe — measured in hours instead of weeks — and identifies which models best align with designated goals. As more data is added, machine learning updates the models without the need for human involvement. This leaves workers to take on more strategic tasks and helps managers make more-informed decisions.
Prescriptive analytics offers solutions for issues recognized by descriptive analytics.
BA also enables ad-hoc reporting, a powerful tool for analyzing specified data in real time. Ad-hoc reporting answers targeted questions, thereby leading to faster and smarter business decisions.
Depending on how a company’s operation is set up, BA may enable a business to eliminate some positions and redeploy staff more effectively.
Adoption of Business Intelligence tools and strategies is growing rapidly and is expected to continue to grow for the foreseeable future. Here are some key numbers, as reported by a variety of sources.
When well thought out and properly implemented, Business Intelligence is an invaluable tool for any company that is determined to thrive in an increasingly competitive environment. For several reasons, an organization would do well to create a strategic plan before getting knee-deep in BI technology, including:
Time. A Business Intelligence solution isn’t built overnight.
Resources. Building a BI solution will involve one or more new technologies and the cooperation of your IT team. Without a strategy before you start, scope creep and wasteful spending are real possibilities.
Buy-in. This can’t be a strictly top-down operation, because if the organization’s personnel don’t recognize the benefits of the system and embrace it, they will resist using it.
These tips will help keep your BI project on track.
Instead of letting the technology or your data drive the project, make a list of objectives, things you want BI to solve. Use that list to identify the KPIs you want to measure, monitor and optimize. Get input from every Line of Business so the right dashboards will be available from the get-go. Make sure all LOBs agree on a set of standard definitions for all KPIs to avoid wasteful duplication and usability issues.
It’s easy to get carried away when doing this, and you may have to institute some limits. If you end up with a list of dashboards that would take your project over budget and push out the completion date, then have your LOBs prioritize the dashboards they requested and have only those of the highest priority created in the first round.
Bringing together data from a variety of different systems means that the data will need to be prepared in order to work together. A team comprised of a representative from each unit whose data will go into the system should meet to answer questions like:
The idea here is not to have this committee do the technical data preparation itself, but to set the parameters that will make sure the data preparation meets the company’s needs.
Every BI implementation needs buy-in from three sources:
Some businesses try to get by with BI that provides only basic dashboards and descriptive analysis. They go into the project feeling that predictive analytics is a luxury they don’t need. Once BI is up and running, they are hit with the realization that they have sacrificed a lot of value by not selecting a platform with Business Analysis built in. Then they scramble to find a bolt-on solution that will give them the predictive analytics they need to accelerate and optimize growth and improve decision making.
If you have data experts on staff who have implemented numerous BI projects, you can skip this tip. But if, like most companies, this is completely new for your teams, save yourself the headaches of trying to DIY. What you pay a BI expert to prepare your data and set up your Business Intelligence and Business Analytics you will more than make up by getting the job done sooner and correctly. There is no price tag on peace of mind.
Follow these five tips and you’ll create a strong foundation for your BI implementation.
The benefits of BI sound simple, but they move companies ahead substantially. Here are some of those benefits:
Given the rate at which Business Intelligence is being adopted, if your competition is gaining on you, it may be that they have started using BI.