Help & Support

212.660.6600

Zoho Analytics

A Review of Zoho Analytics as a Business Intelligence tool for data-driven companies seeking to make better business decisions

4

About Zoho Analytics

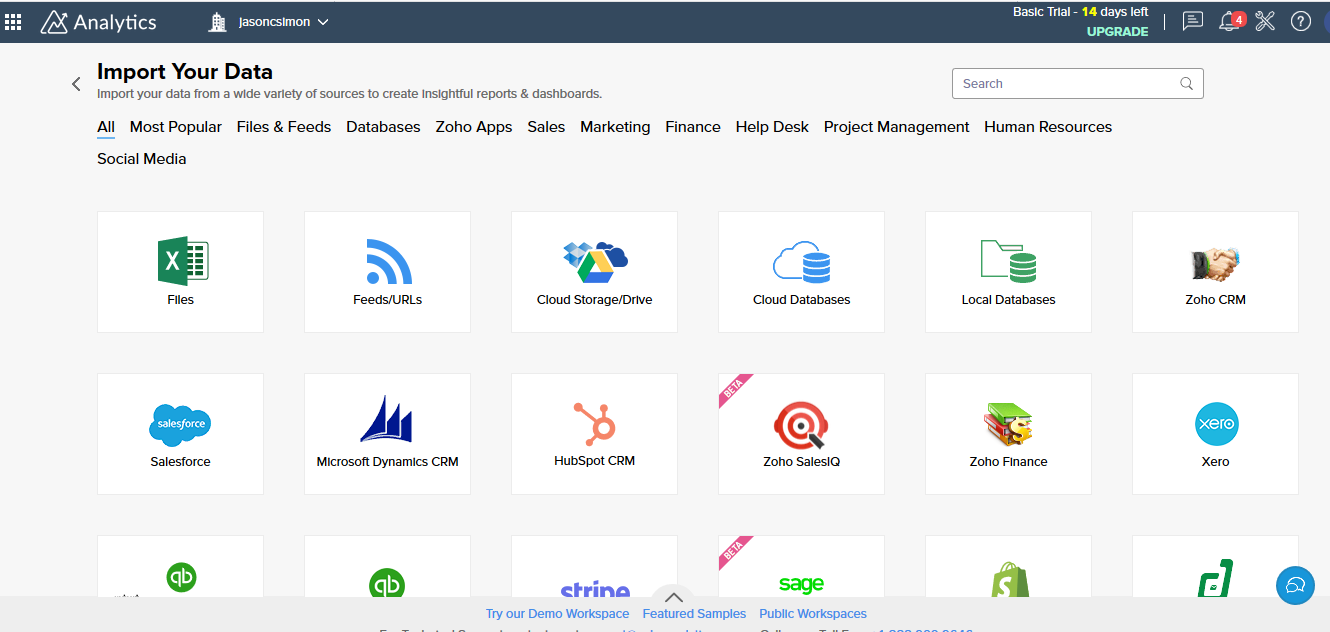
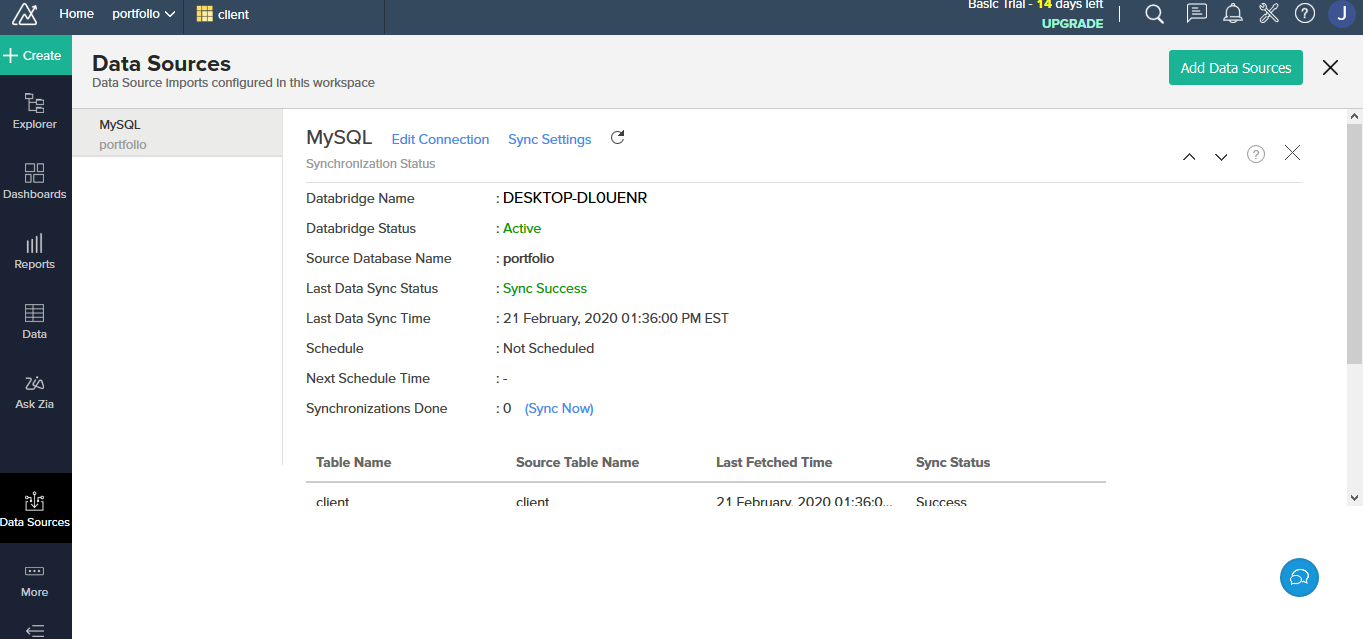
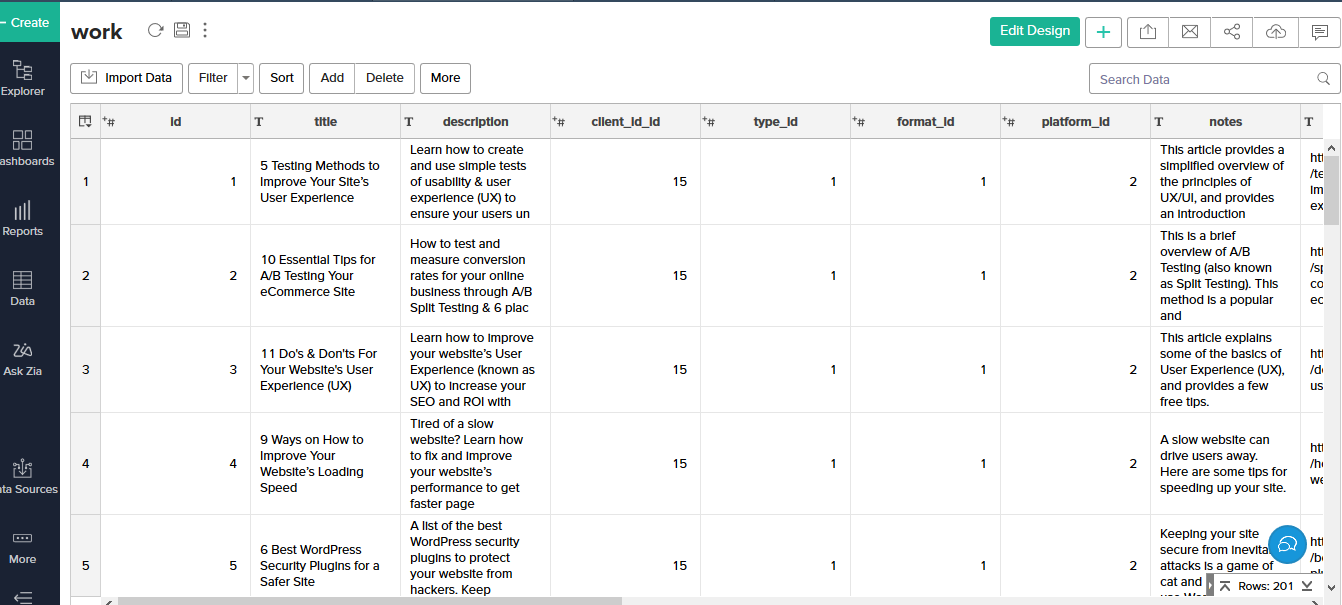
Zoho analytics is a cloud-based, self-service business intelligence and reporting service. Formerly known as Zoho Reports, it allows connections from a wide range of data sources, from locally stored files, cloud drives, local or cloud databases, many popular business apps and custom apps. 

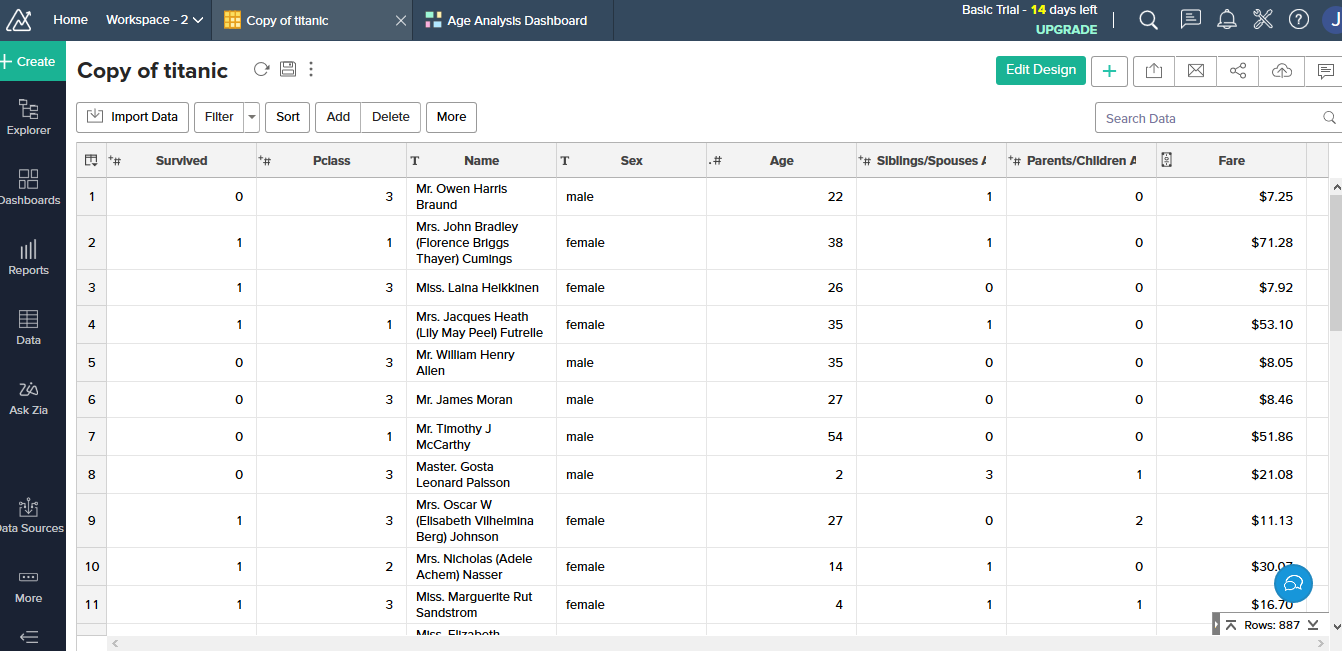
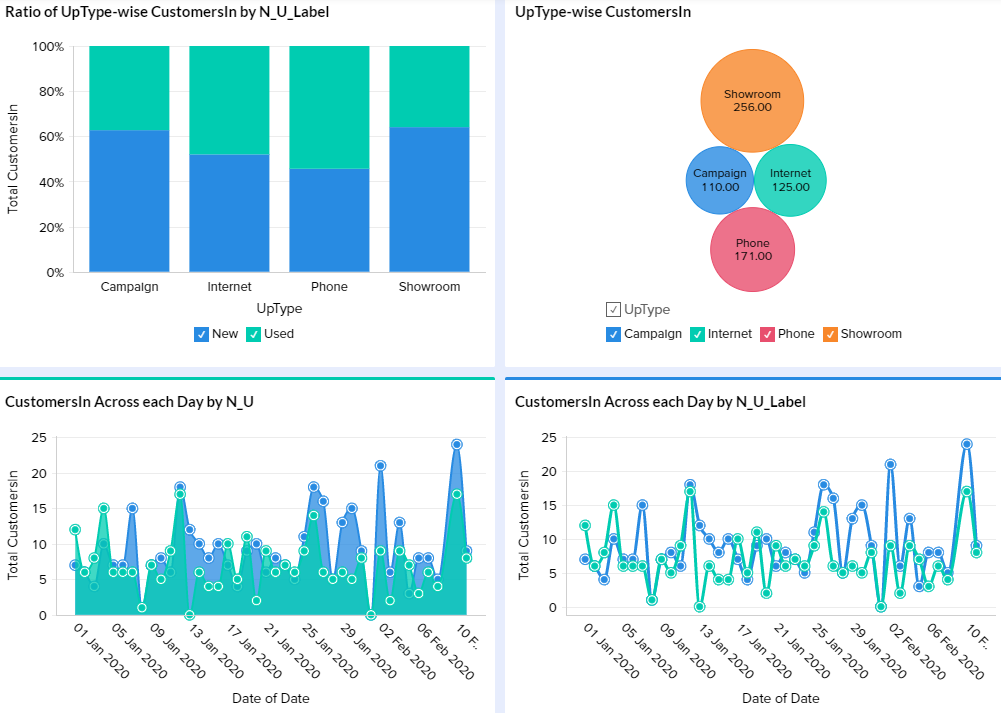
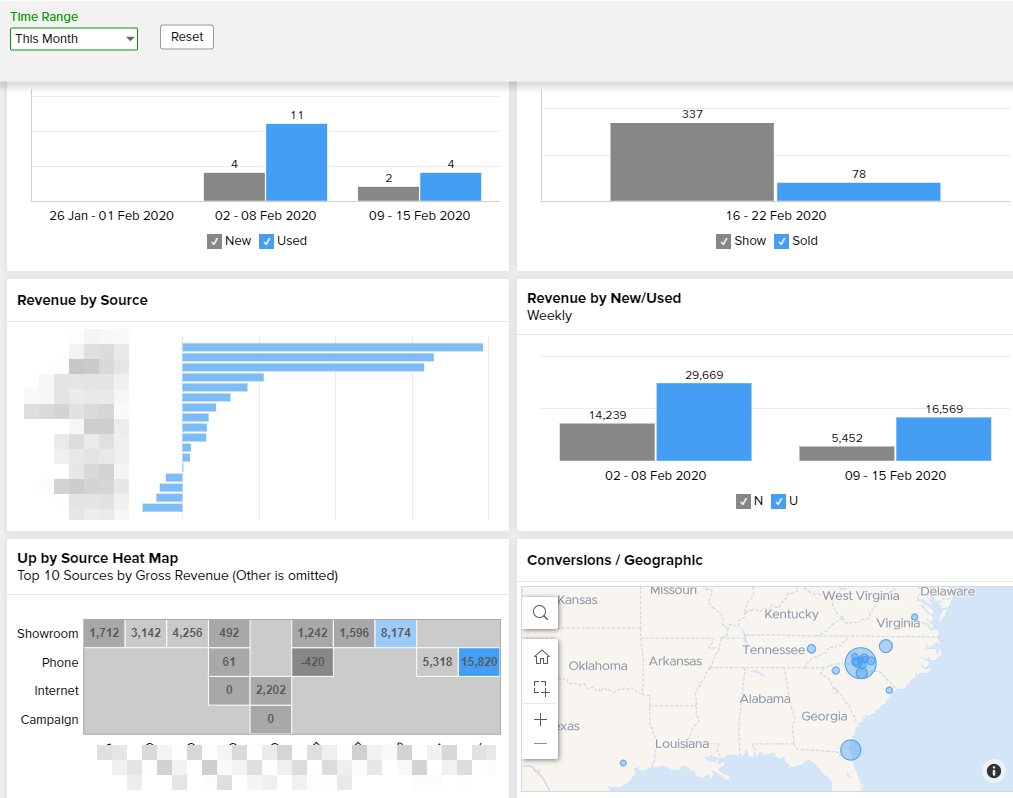
It boasts a user-friendly interface which will allow users to include data from multiple sources to be able to create attractive and useful Business Intelligence tables, charts, and graphics. Zoho Analytics offers a range of applications within its suite, including everything from analysis, reporting to data storage. It has a drag and drop interface which enables the creation of many customized widgets and multiple dashboards. All of these functions serve to make it easy to get useful and insightful reports for informed decision making. 

Zoho Analytics is designed for businesses who wish to take advantage of many of the features offered in professional-level Business Intelligence packages, without spending a premium getting started. While it is not as extensive as some of the more advanced BI and ETL tools, its price point makes it an attractive candidate for many small businesses and non-profit organizations.

Zoho Analytics also offers a free plan for individuals which supports 2 users and 5 workspaces, and 10,000 rows of data in the account. For small businesses, rates start low, and it is scalable to adapt to many of the needs of larger organizations. 

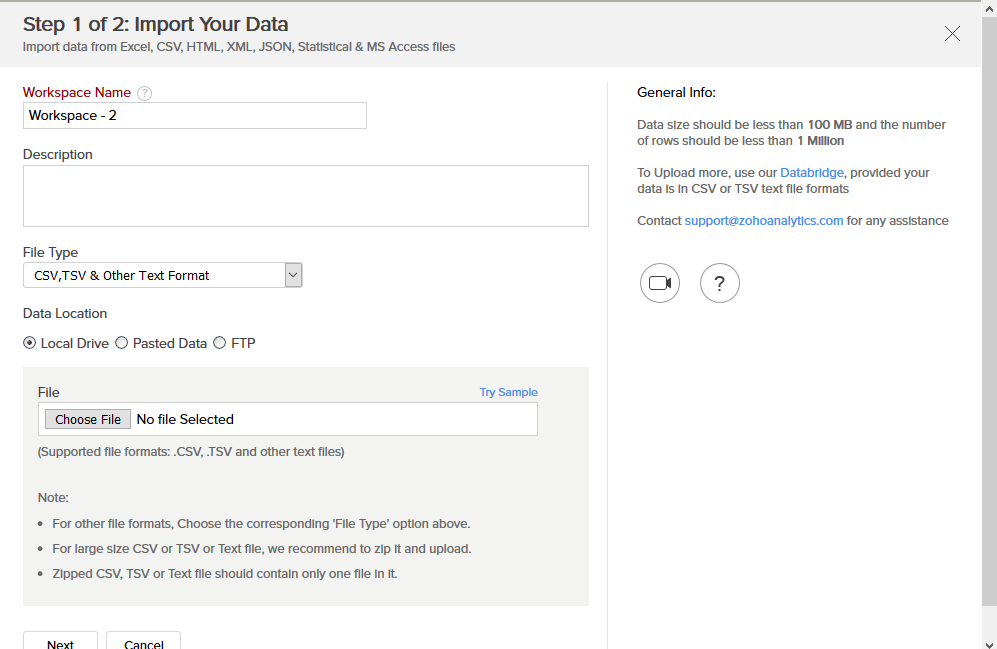
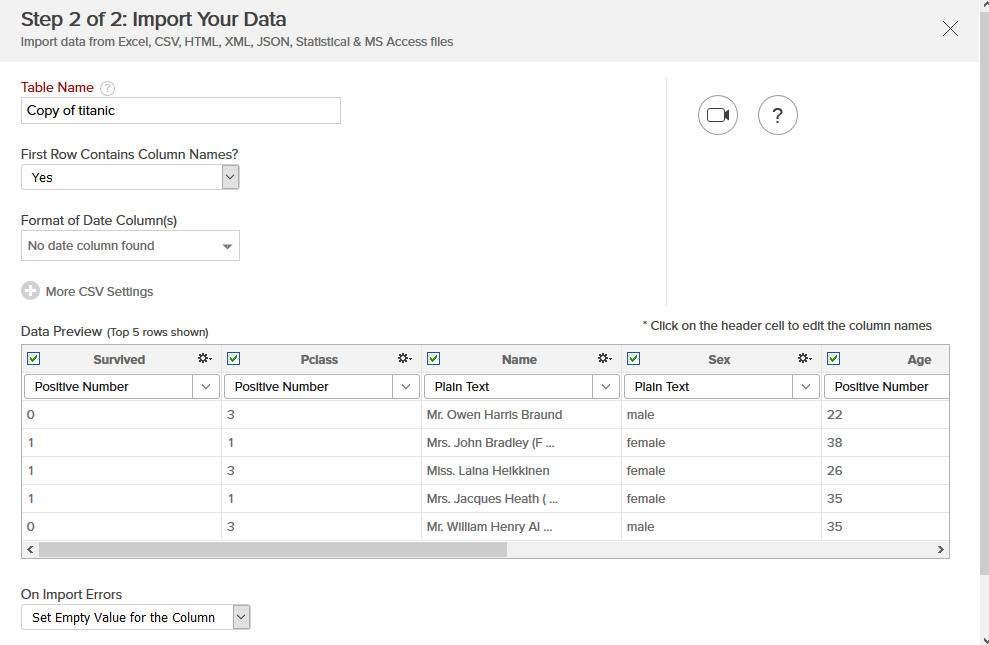
It is particularly appealing for those organizations which wish to make use of powerful visualizations but may be lacking in technological know-how or resources. For some basic reports and graphs, using Zoho Analytics is often as easy as choosing a file and letting the app create a number of intelligent representation of data. While to build custom reports, like those that display the data from several different sources, some technical skill is required. 

Features

Below is a selection of some of the basic features that Zoho Analytics offers out of the box. 

Importing Data Sources

You are provided the option of importing data directly from Excel or CSV files, as well as many other popular file formats, such as JSON, XML, and more. You can also import data from various online and locally hosted databases, and social media accounts. Beyond this it offers a host of connectors for importing data from a wide range of products.


image6_16.png


Below is a simple demonstration of loading standard file formats.

image8_11.png


During this process you are given a brief preview of the data contained in the import, and the ability to make changes to the data types, date formats, and more. 

image7_16.png


Data Views

Upon import, Zoho Analytics will automatically generate reports based on the data you have supplied. You can manipulate, filter, and sort your data to prepare it for analysis. You can work in more detail in the files that have been imported and perform any necessary data cleanup or manipulation. 

image9_7.png


Widgets

With this data, it will automatically create a number of widgets using its internal AI feature for identifying common useful charts. These can be easily organized into dashboards.

image1_25.png


Below is a view of another custom dashboard from a different dataset. You can include tabular representations of your data as well as numerous charts.

image4_16.png


Database Connections

Connecting to a local database requires installing their “Databridge” application. To make it work, you need to start it from Windows services manually. Zoho Analytics will then sync up the data from the database so that it can be read.

image11_3.png


It’s possible to import data from individual tables, like so:

image14_1.png


Or one can import the entire database and create views using SQL to join together different tables.

image12_2.png


Database Visualization

Zoho will also display the structure of the database, which can be helpful for constructing queries later.

image15_2.png


Data Manipulation

One can work with the imported tables with user-friendly pivot tables and filters. Results of pivots and filters can then be viewed in real-time to create the information that one needs.

image10_7.png


These charts can easily be converted into an effective dashboard;

image13_1.png image5_16.png


Collaboration

Zoho Analytics provides a number of useful collaboration features, including the ability to create groups of users.

image2_21.png

Charts and dashboards can be shared via email. To be able to access the results, users need an account within Zoho Analytics.

image3_21.png

Summary: Key Takeaway

Zoho Analytics is excellent for individual users, small businesses, and non-profit organizations who need some basic BI tools. The large number of extensions and connectors make it possible to gain some valuable analytics from all aspects of a business, ranging from local files, to sales, marketing, financial, project management, and far more. 

It is very affordable making it accessible in ways that more elaborate and expensive tools such as Domo are not. 

That said, the functionality in Zoho Analytics is not particularly extensive. If one needs to do more elaborate data modeling, and combining different datasets, or connecting to Big Data, one will likely need other tools as well. Xperra data experts are happy to consult on the best-fit tool kit based on the business needs. Data preparation tools to consider are KNIME or Alteryx to get data in shape before loading.
However, the ability to create simple, easy-to-use graphics can be a boon for many smaller organizations.


Integrations

Basic Connectors

  • CSV, XLS, XLSX, TSV

  • JSON

  • HTML, XML

  • Zoho Docs

  • Google Drive

  • Microsoft OneDrive

  • Dropbox

  • Multiple SQL databases (MySQL, Oracle, MSSQL, PostgreSQL, etc.)

  • NoSQL Databases (MongoDB, JDBC Driver supported NoSQL DBs)

  • Azure, AWS, Google Cloud

Sales Analytics

  • Zoho CRM

  • Salseforce

  • Microsoft Dynamics CRM

  • Hubspot

  • Other CRMs using Flatly

Marketing Analytics

  • Zoho Campaigns

  • Mailchimp

  • Google Analytics

  • Google AdWords

  • Bing Ads

  • Zoho Survey

  • SurveyMonkey

  • SurveyGizmo

  • Facebook

  • Twitter

  • YouTube

  • LinkedIn Ads

  • EventBrite

Financial Analytics

  • Zoho Books

  • Quickbooks

  • Xero

  • Stripe

  • Zoho Subscriptions

  • Zoho Inventory


eCommerce Analytics

  • Shopify

Project Management Analytics

  • Zoho Projects

  • Teamwork Projects

Helpdesk Analytics

  • Zoho Desk

  • Zendesk

  • Teamwork Desk

  • ManageEngine ServiceDesk Plus

  • ManageEngine SupportCenter Plus

HR

  • Zoho Recruit

  • Zoho People

Others

  • Reporting on Zoho Creator Apps

  • Zoho BugTracker

  • APIs

Xperra Star Ratings

Functionality useful to a business
4 /5

Zoho Analytics has a wide range of tools that many small businesses or organizations will find to be useful. It can bring in data from a multitude of sources, and creating meaningful graphs and dashboards is very easy. Sharing data is also helpful. 


However, to take full advantage of Zoho Analytics, some technical expertise is needed. If one wants to combine data from multiple datasets into a common format and then build a chart based on this data, it will either require constructing some complicated SQL queries or using a separate ETL tool. In this regard, requesting assistance from data experts such as those provided by Xperra will let one easily get a custom dashboard that fully reflects the current objectives.

Intuitive User Experience
5 /5

The look and feel of Zoho Analytics is very appealing; especially considering its price. It’s very easy to use, and there is very little need to use the manuals for most of the basic functions.

Working with most aspects of Zoho Analytics are quite intuitive; in fact, getting data from a spreadsheet into Zoho was self-explanatory. Graphs and charts are created on the fly, at the moment a file is imported. Using the pivot tables is also easy; in fact, the interface seems a little simpler than the ones that are used in Excel.

Active Support Community
2.5 /5

Official Forum:

https://help.zoho.com/portal/en/community/zoho-analytics

The help board seems to be manned by staff from Zoho who are there to help users with public questions. However, there does not appear to be a lot of community support beyond a vendor/user relationship.

There appear to be several people asking questions, however user questions seem to be largely going unanswered, at least those mentioned in the past few days. There is virtually no cross-discussion happening. 

The Zoho staff appear to make use of the community boards for posting announcements regarding new services, bug fixes and updates.

Minimal Technical Skill Required
2.5 /5

For the most basic aspects of Zoho Analytics, getting it to work requires almost no knowledge beyond already existing skills that might be applied to working with spreadsheets. In fact, much of the work is done for the user, and the built-in AI does an excellent job of handling most data. The design is such that the user is not expected to know much at all beyond basic data manipulation.

The only areas where it requires a little more knowledge lie within some of the more advanced features such as connecting to a database; to make this work properly, one should likely know a little SQL. That said, it is easier to use than many of the existing database interface tools on the market. Moreover, after engaging an experienced technical team for Zoho Analytics set up, it can be then easily used and supported by any person with no specific skills needed. 

Related Experts

Data Scientist

Data Scientist

Data Analyst

Data Analyst

Data Engineer

Data Engineer

Related Solutions

Tune Your Data For Peak Performance

Tune Your Data For Peak Performance

Better Marketing Decisions

Better Marketing Decisions

Gain a 360⁰ View of Your Customers

Gain a 360⁰ View of Your Customers

Other Tools

Alteryx
Data ETL & Data Wrangling Commercial

Alteryx

Alteryx is the only quick-to-implement end-to-end data analytics platform for your organization that allows data scientists and analysts alike to solve business...

KNIME Analytics Platform
Data ETL & Data Wrangling FREE Open Source

KNIME Analytics Platform

KNIME Analytics Platform is a powerful free open source data mining tool which enables data scientists to create independent applications and services through a...

Domo
Business Intelligence (Reporting and Visualization and Dashboards) Commercial

Domo

Domo is a fully cloud-based Business Intelligence tool which is designed to provide a central place for viewing and monitoring business data regardless of its p...