Help & Support

212.660.6600

Domo

A review of DOMO as a Business Intelligence tool for companies wishing to extract more business value from their data

4.5

About Domo

Domo pitches itself as the “operating system for your business.”   It is a fully cloud-based Business Intelligence tool which is designed to provide a central place for viewing and monitoring business data regardless of its point of origin. 

This BI tool is designed from the perspective that visualizing a company’s data is important, but also difficult if it is scattered in a multitude of different locations.  Domo provides a centralized place for tying together information from cloud-based, online, and offline sources into a central platform where information can easily be viewed and analyzed for business purposes.    

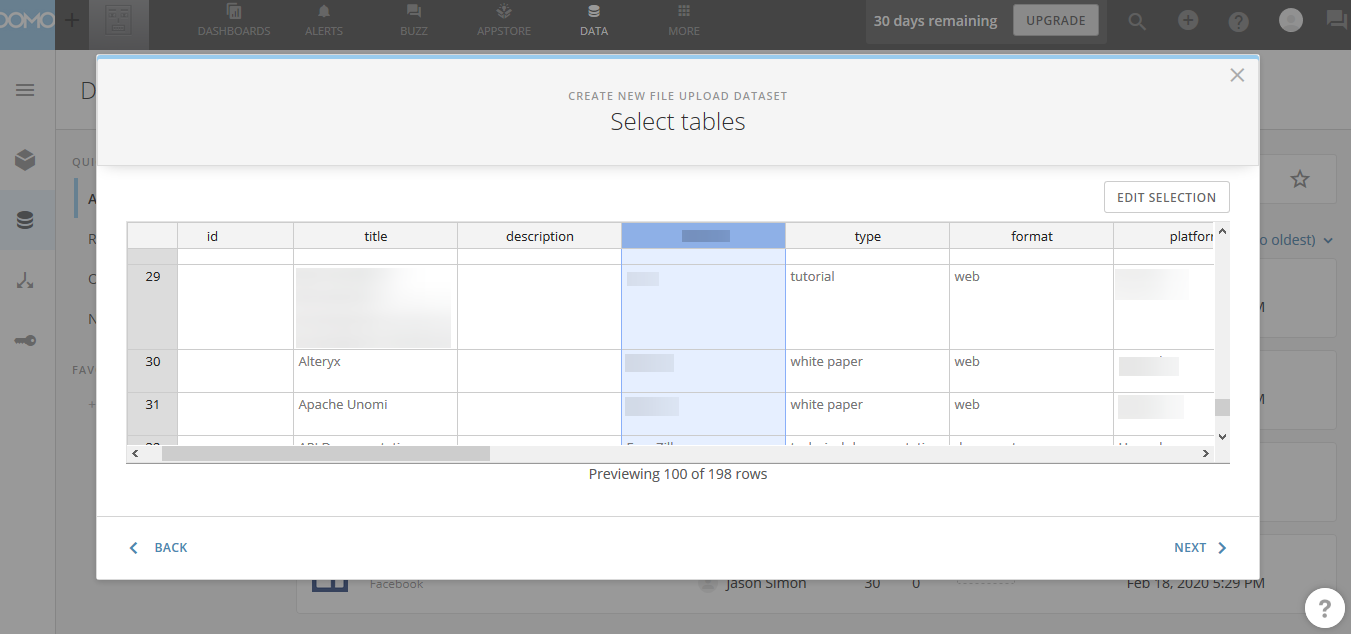
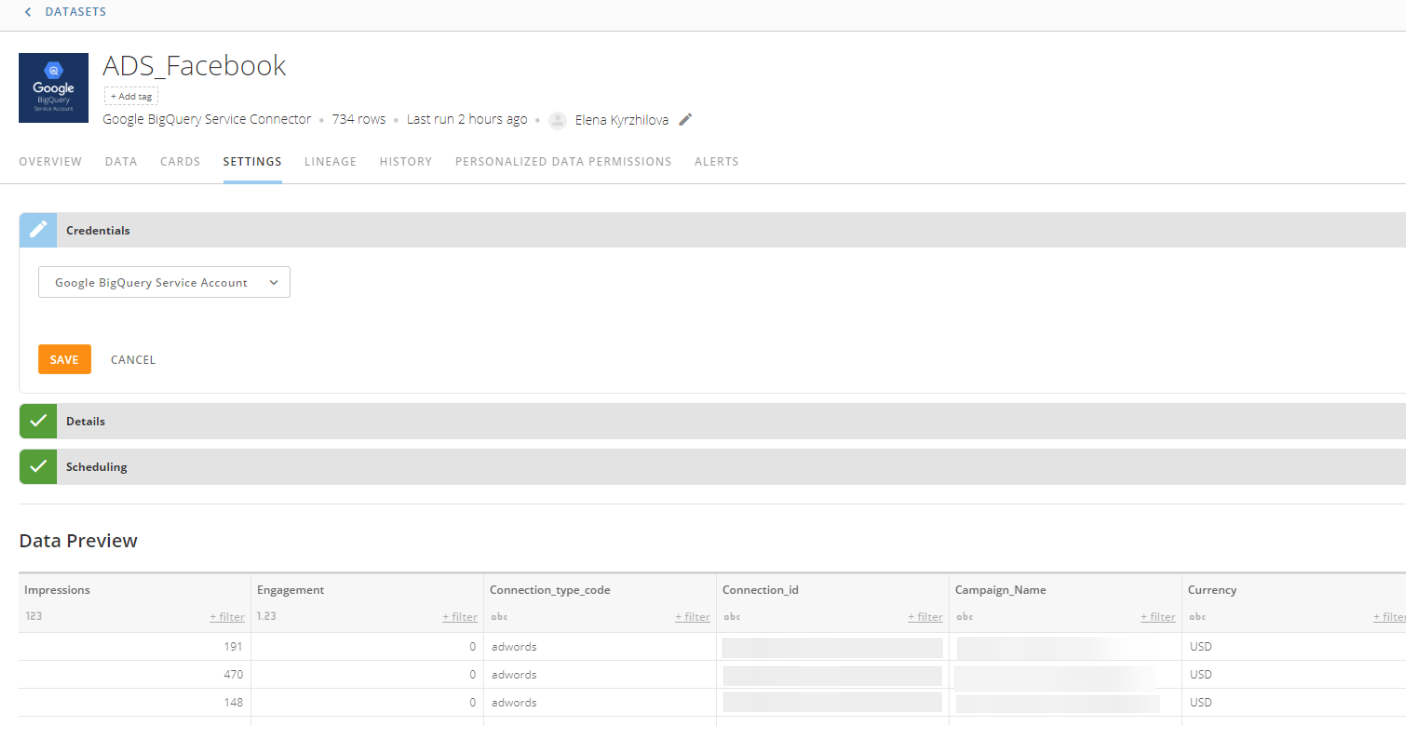
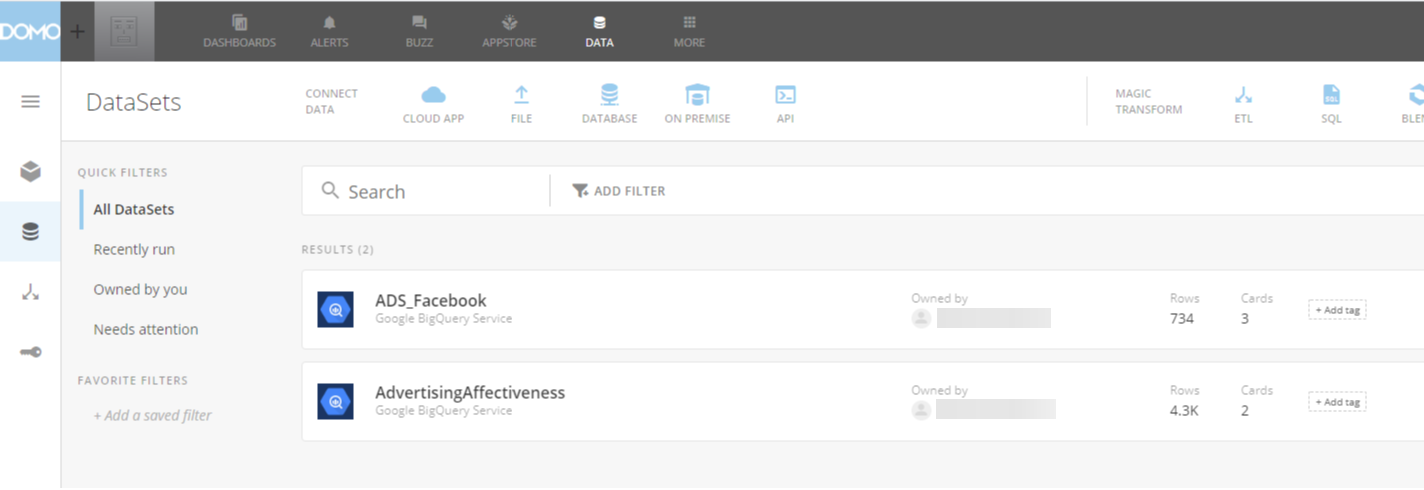
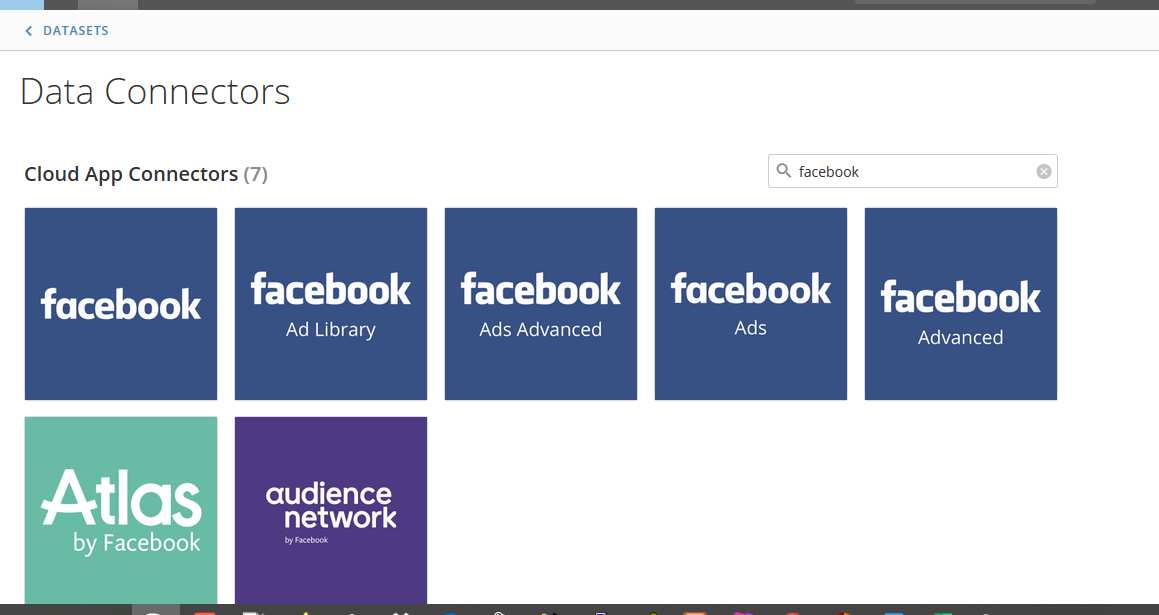
Domo has hundreds of different connectors and extensions which make it possible to perform the extraction part of ETL functions on multiple datasets with a minimum level of technical know-how.  It features the ability to simply choose one of many extensions to aggregate both structured (databases and spreadsheets) and unstructured data (social media platforms, CRM data, etc.) to a central platform enabling users to quickly manipulate, organize and display data, and share it with others, including those who use the platform, and those who do not. 

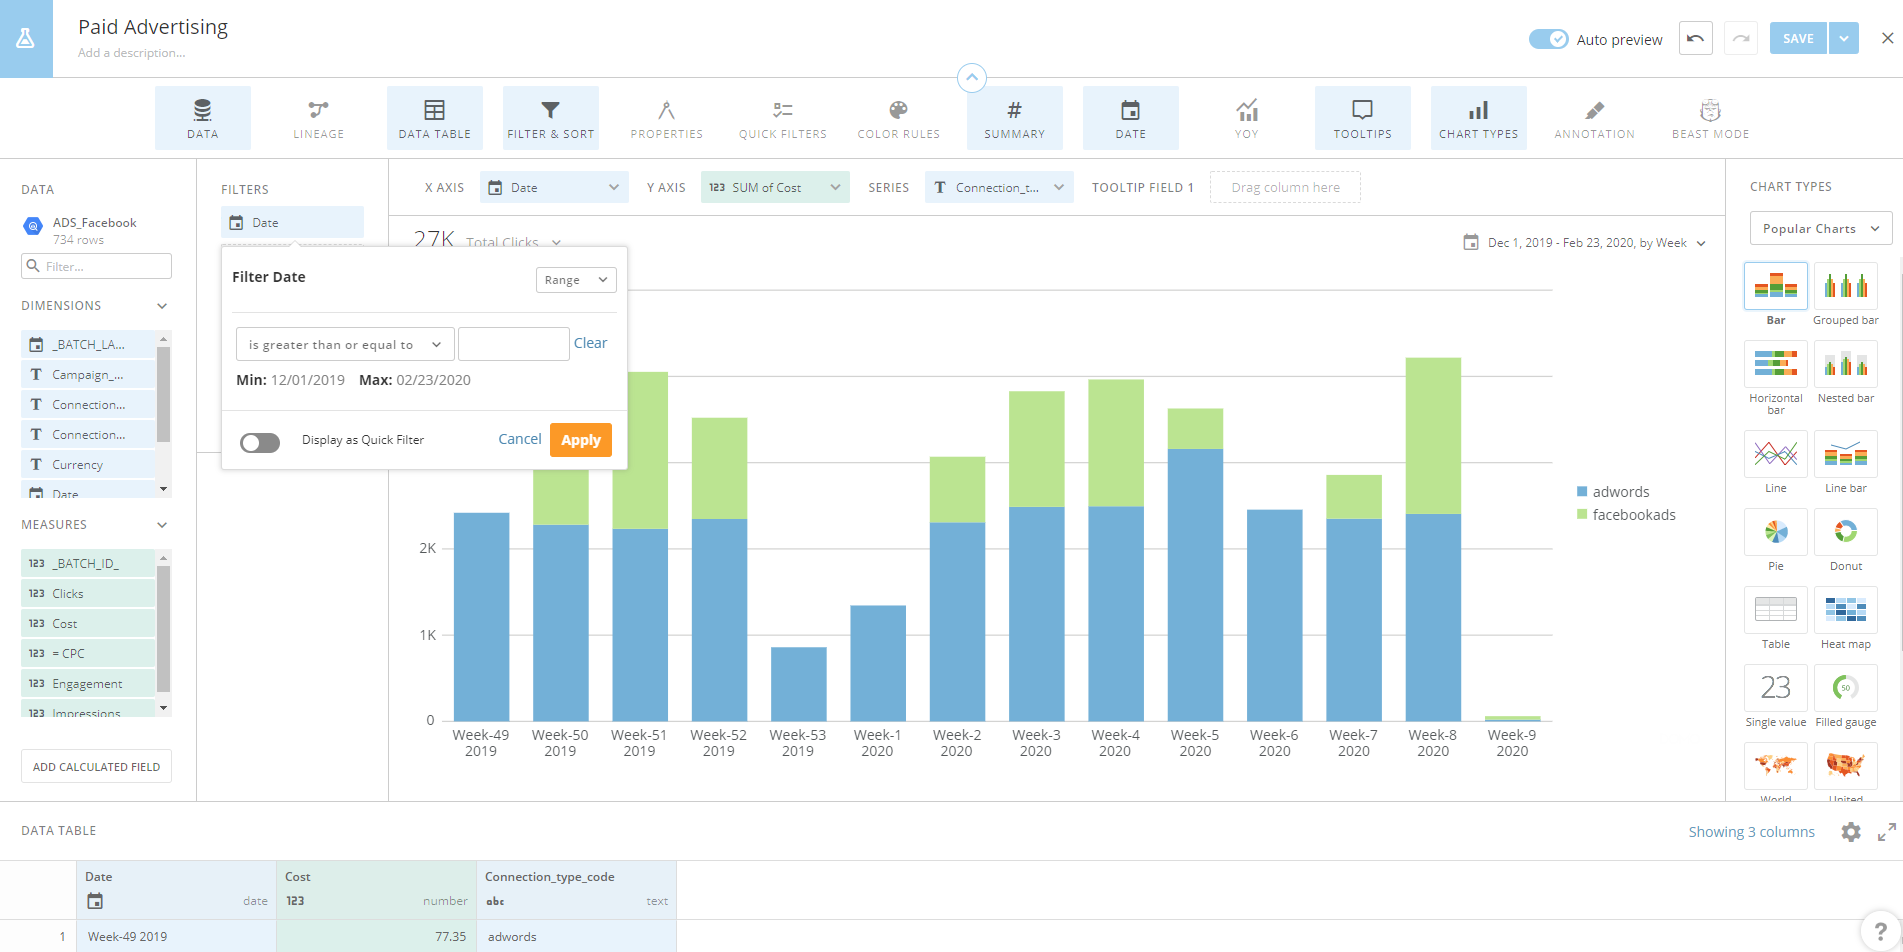
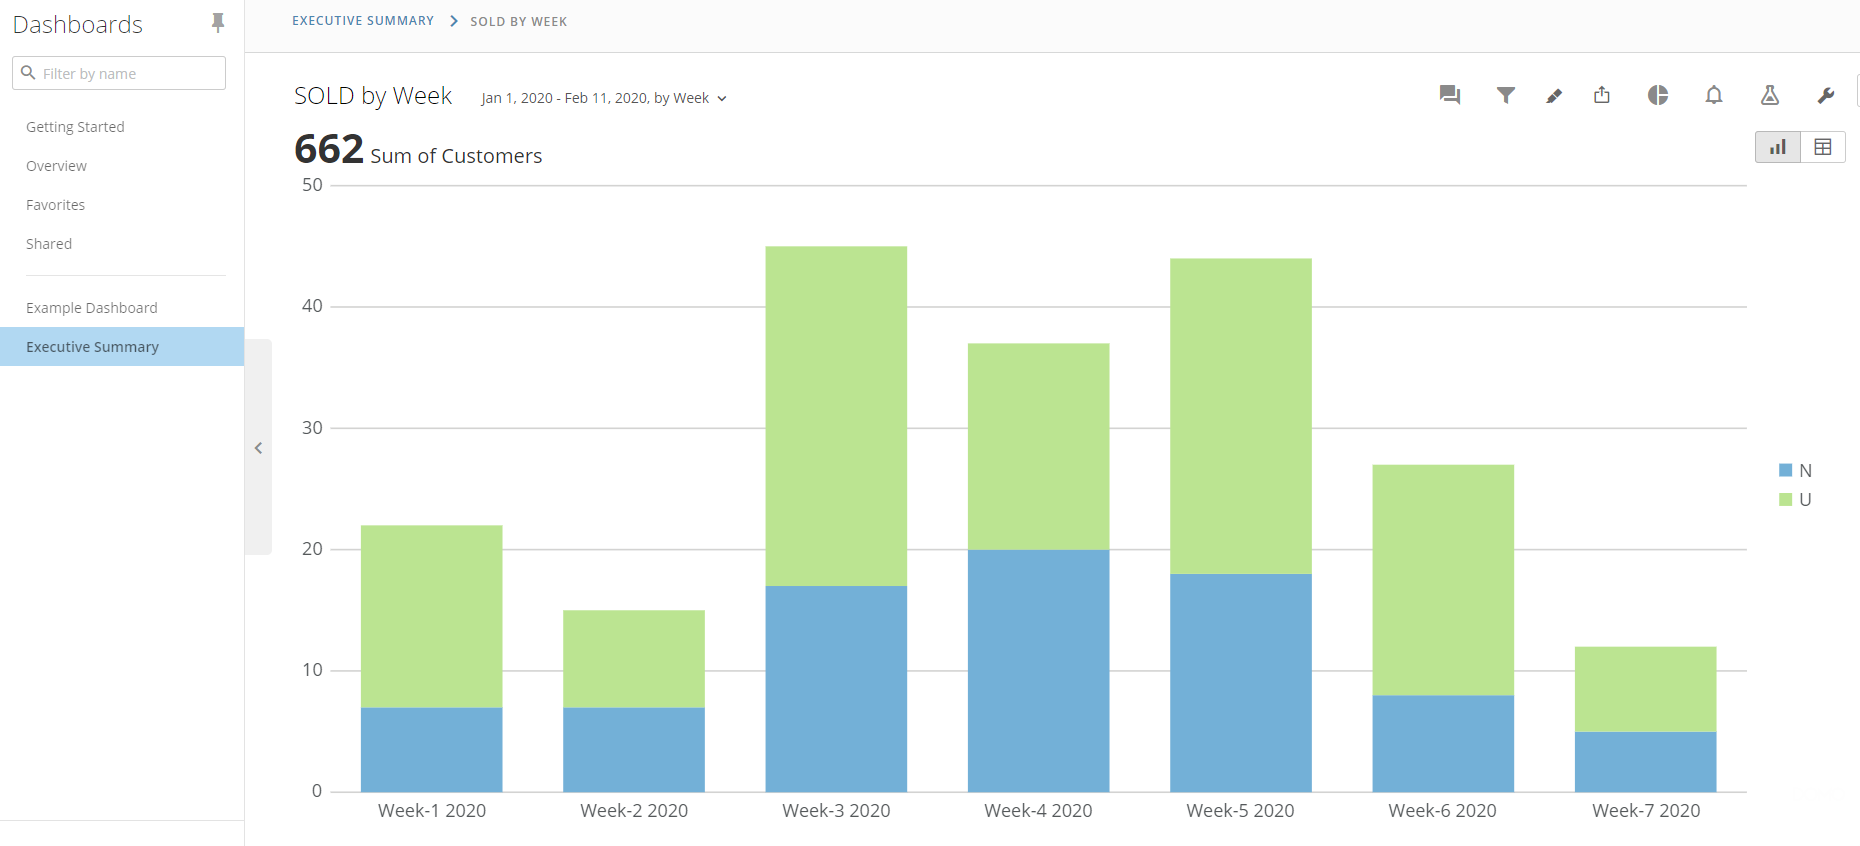
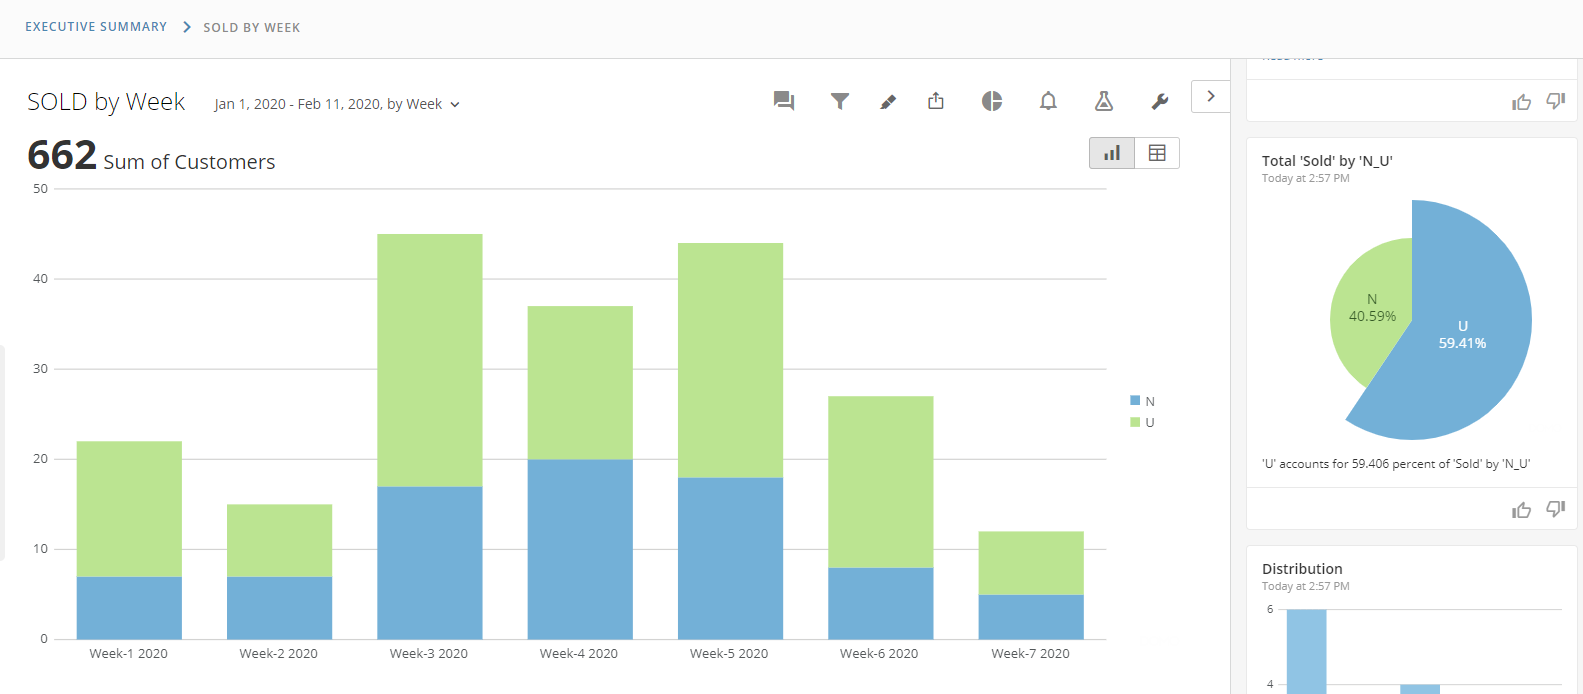
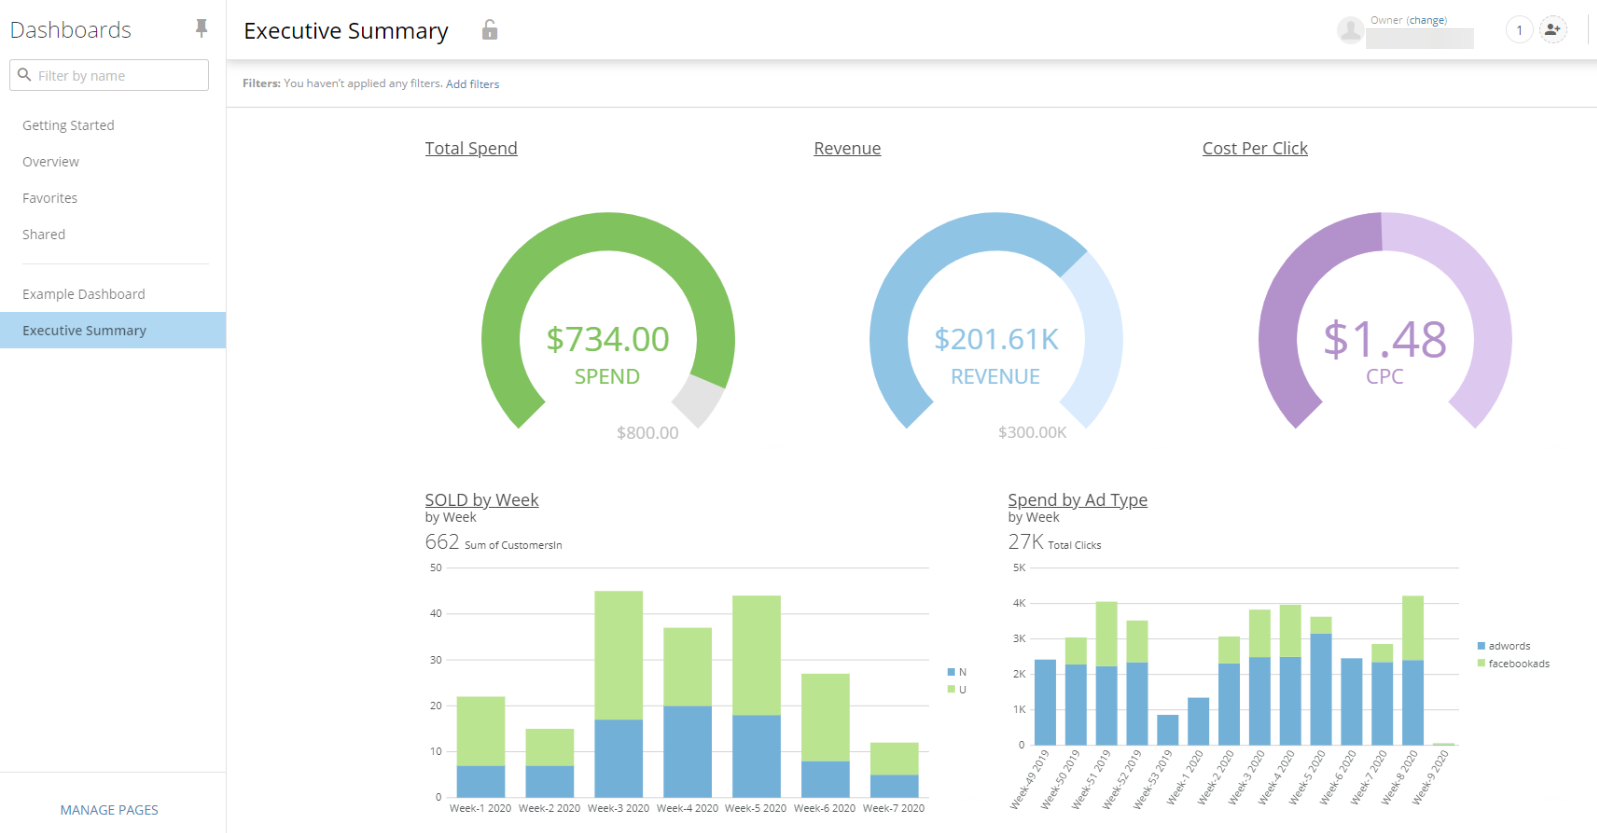
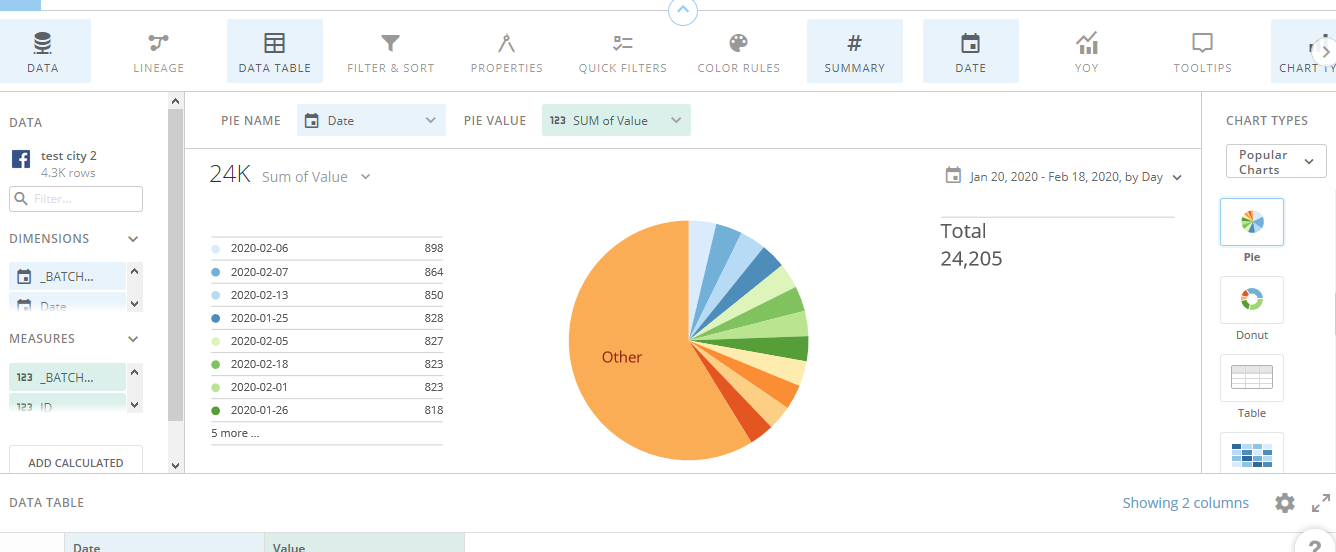
It allows you to organize mini presentations in the form of “cards.”  It contains a large set of built-in features which will automatically suggest visualizations of existing data.  This data can easily be displayed in a variety of different charts, graphs, and tables for creating easy-to-understand representations of business data.

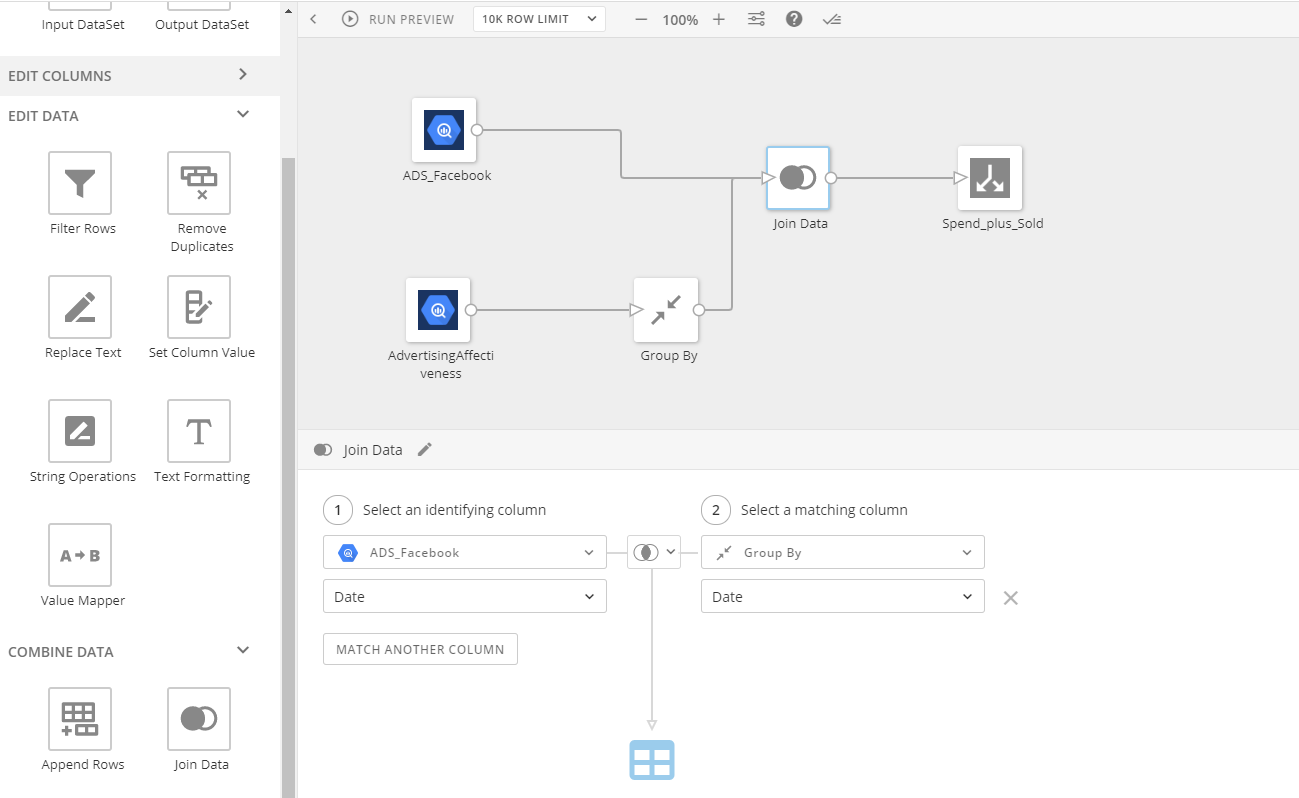
Domo also allows you to combine data sources automatically, or with some basic ETL tools, which enable those with some level of technical skill to be able to query them using SQL-like queries. 

Domo contains a series of automated reporting features, which enable viewing in real-time on mobile platforms.  It comes with a series of automated alerts which can be triggered based on set specifications based on changes to data.   Data can be exported to be emailed or published to the web even if people do not have access to the application. 

Domo consists of 7 different products which are designed to be treated as a whole:

  1. Connect – For loading in data, whether cloud-based or housed on premise 

  2. Adrenaline – This is their intelligent data warehouse, which is designed to be used for custom calculations

  3. Fusion – This is essentially the ETL tool which will cleanse, combine, and prepare data for use without needing outside applications

  4. Explorer – This is a tool for managing information about the internal workings of a business, including organization charts, interested parties, etc.  

  5. Buzz – These are built-in collaboration tools which include chat, sharing, and annotations regarding data visualizations.

  6. Mr Roboto – This is the built-in Machine Learning tool, designed for tracking trends, anomalies creation, correlation, optimization, and to provide alerts, data consumption patterns, trending focus points and more. 

  7. App store – Includes apps, dashboards, connectors, algorithms, and solutions.

Features

Connecting Spreadsheets

When loading data in a CSV or Excel format, you are immediately given a preview of a subset of your data, where you can edit your selections to choose which fields you need. 

image2_19.png

Simple Visualizations

From here you can create several simple visualizations.  For instance, in this particular chart we can take a look at net pay distributed between 1/1/2019 and 1/1/2020.

image8_9.png

Dashboard

Once the calculations have been made and you are satisfied with a set of results, each chart can be saved as a “card” which can then be viewable in a clean dashboard format, and can be annotated and shared with users using the “Buzz” feature described above.   

image4_14.png


Here is an example of the above chart as a card.

image8_10.png


Here’s an alternate card using some of the same data with a monthly bar chart. You can see an example of an automatically generated quick “insight” based on the data provided. 

image1_23.png

Data Connectors

One of the more helpful features in Domo is the ability to connect to external cloud-based applications. While the above was data loaded from a spreadsheet, Domo provides a large set of built-in data connectors to automatically import information from online platforms.

Below, we can see with a quick search for “Facebook,” a list of different connectors for importing data from Facebook systems.

image5_14.png


Bringing in the data itself is simple, using a built-in wizard.

image10_6.png


Once the data is imported, it can be visualized much like we did with our spreadsheet data from above.  Here’s a simple pie chart generated from “likes” of a Facebook page over time. This can be particularly useful if tracking, for example, popularity during a specific advertising campaign.

image6_14.png

View of your Datasets

image3_19.png

ETL tools

Domo has some built in features for cleaning and merging data you wish to aggregate. One can bring in data from a spreadsheet, database, cloud application or more and then clean and organize the data by dragging and dropping modules onto the workbench and configuring each to perform a specific task.

This tool can be helpful for those who may wish to deal with database information without knowing any detailed SQL.

image7_15.png

Sharing Data

Data is easily shared using the profile tool. It allows you to provide and/or find information about others in the company with whom you wish to share or collaborate on a project

The Buzz feature enables adding annotations and communicating with others within the organization. 

Summary: Key Takeaway

Overall, if looking for a comprehensive tool for managing data for an organization and providing some good Business Intelligence functionality, you can get a lot of what you may need by using Domo. Its ability to integrate data from multiple sources with a minimal level of required technical ability make it a fairly powerful application for many companies’ needs.

There are a few drawbacks.  Its cloud based nature could be a problem if most of your data is hosted locally; copying data from one location to another can be problematic. Fees for the transition from locally hosted to cloud hosted can get somewhat steep. Domo is also somewhat expensive: it costs upwards of $50K, so it may not be ideal for small companies. For smaller companies on a budget, a lighter tool such as Zoho Analytics or ClicData, might be more appropriate. Xperra experts can provide advice on which tool is the best choice for various use cases.

Data appears to be unidirectional for the most part. One thing to be careful about is maintaining data in a separate location and using Domo as a tool for BI purposes only, but not as a data warehouse, which is beyond what it is designed to do. Part of the reason for this is that data extraction is somewhat difficult. It’s more designed for importing data; if one wishes to export data, the only options available are CSV, Excel, and PDF formats.

Integrations

Domo has too many integrations to list here, however it provides easy access to a wide range of datasets including all social media platforms, such as Facebook, LinkedIn, Twitter, Instagram, and more,  Connectors exist in the following categories:

  • Marketing Tools

  • IT

  • BI

  • Finance

  • Operations

  • Customer Service

  • Human Resources

  • Sales

  • Spreadsheets

  • Cloud connectors

  • On-premise connectors

  • IoT

  • Ads

  • Analytics

  • more

For Business Intelligence purposes, it connects to: 

  • Github

  • Jira

  • Amazon S3

  • JSON (any source that uses this)

A wide range of databases including:

  • MySQL

  • PostgreSQL

  • MSSQL

  • Amazon Redshift

  • Snowflake

  • Google BigQuery

  • ODBC/OLAP connectors

  • Oracle


This is only a small subset of the connectors that are available.   To get a better picture, it may be best to browse their connectors.

Xperra Star Ratings

Functionality useful to a business
4.5 /5

Domo is a tool which can help many businesses combine and visualize data.   Particularly helpful is the way that it can integrate 

  • CRM

  • Web Analytics

  • Databases

  • Order processing

  • Invoicing

and to be able to view all data in one place.

For many companies whose employees are regularly on the go, it’s possible to get real time updates on mobile devices, which can make their use in business presentations easy.   

There are a few minor drawbacks.  The reporting functionality, while good for Domo users, does not allow one to set up reports to automatically mail to people who are not users of the application.   Also, while there are many trigger-based reporting applications, it does not have any functionality for setting up scheduled reporting. 

Intuitive User Experience
4 /5

Using Domo is fairly straightforward.   Many of the tools will work right out of the box.  At any point where a user runs into problems, there are a wide range of tutorials and videos for educational purposes.  They also provide a full “Domo University” for those who wish to learn more about the application.

That said, to be able to truly get the most out of Domo requires some expertise; to use some of the more advanced features requires experience.  Many existing connectors are essentially demos and are not designed to work “out of the box” and require some detailed configuration to work with your individual datasets. For this reason, many Domo users find that engaging experts such as those provided by Xperra, will allow them to create business value more quickly.

Active Support Community
4 /5

https://dojo.domo.com/ 

Forums appear to be quite active, with several questions and answers per hour.   The user community appears to be fairly responsive.

Topics are divided into sections so one can narrow down searches dependent on the nature of problem or question.   These are divided into main sections such as 

  • “Beast Mode”, ETL, Dataflow

  • Card Building

  • Data Sources and Connectors

There are also sections listed for those who are looking for basic information.     The site is filled with tutorials, and videos to help anyone who is more of an autodidact and wishes to learn how to handle each of these topics on their own.

Minimal Technical Skill Required
4 /5

Getting started with the basics, particularly if spreadsheets or data are already well-organized is fairly straightforward, and much can be accomplished without relying too much on a manual.  Some of the suggested visualizations happen automatically without much need of interaction or manipulation. Manipulating data is not much more difficult than using spreadsheet tools such as Excel.

Some of the more advanced tools, such as the ETL functionality is more complicated;  while there are some built-in walkthroughs, to really get more out of this, particularly when it comes to combining data from multiple data sources requires experience.   

It’s important to note that the ETL tools are somewhat simplistic, which appears to be part of the goal;   more advanced users may find themselves a little frustrated by some of the limitations; ETL functionality is a little weak when compared with pure ETL tools. At Xperra we often use other ETL tools such as KNIME or Alteryx for more complex data transformation scenarios to prepare the data before loading into Domo. 

Related Experts

Data Analyst

Data Analyst

Data Engineer

Data Engineer

Data Visualization Engineer

Data Visualization Engineer

Related Solutions

Better Marketing Decisions

Better Marketing Decisions

Tune Your Data For Peak Performance

Tune Your Data For Peak Performance

Capture Actionable Data From Anywhere

Capture Actionable Data From Anywhere

Other Tools

Alteryx
Data ETL & Data Wrangling Commercial

Alteryx

Alteryx is the only quick-to-implement end-to-end data analytics platform for your organization that allows data scientists and analysts alike to solve business...

Tableau
Data Visualization Commercial

Tableau

Tableau is a Business Intelligence tool created to help anyone see and understand their data. Connect to almost any database, drag and drop to create...

KNIME Analytics Platform
Data ETL & Data Wrangling FREE Open Source

KNIME Analytics Platform

KNIME Analytics Platform is a powerful free open source data mining tool which enables data scientists to create independent applications and services through a...