DataRobot’s Automated Machine Learning allows the creation of advanced regression and classification models, ranging from simple linear models to gradient boosting and neural networks. It also comes equipped with many beneficial visualization tools which can assist with better understand your data and the performance of your chosen learning models.
Data exploration
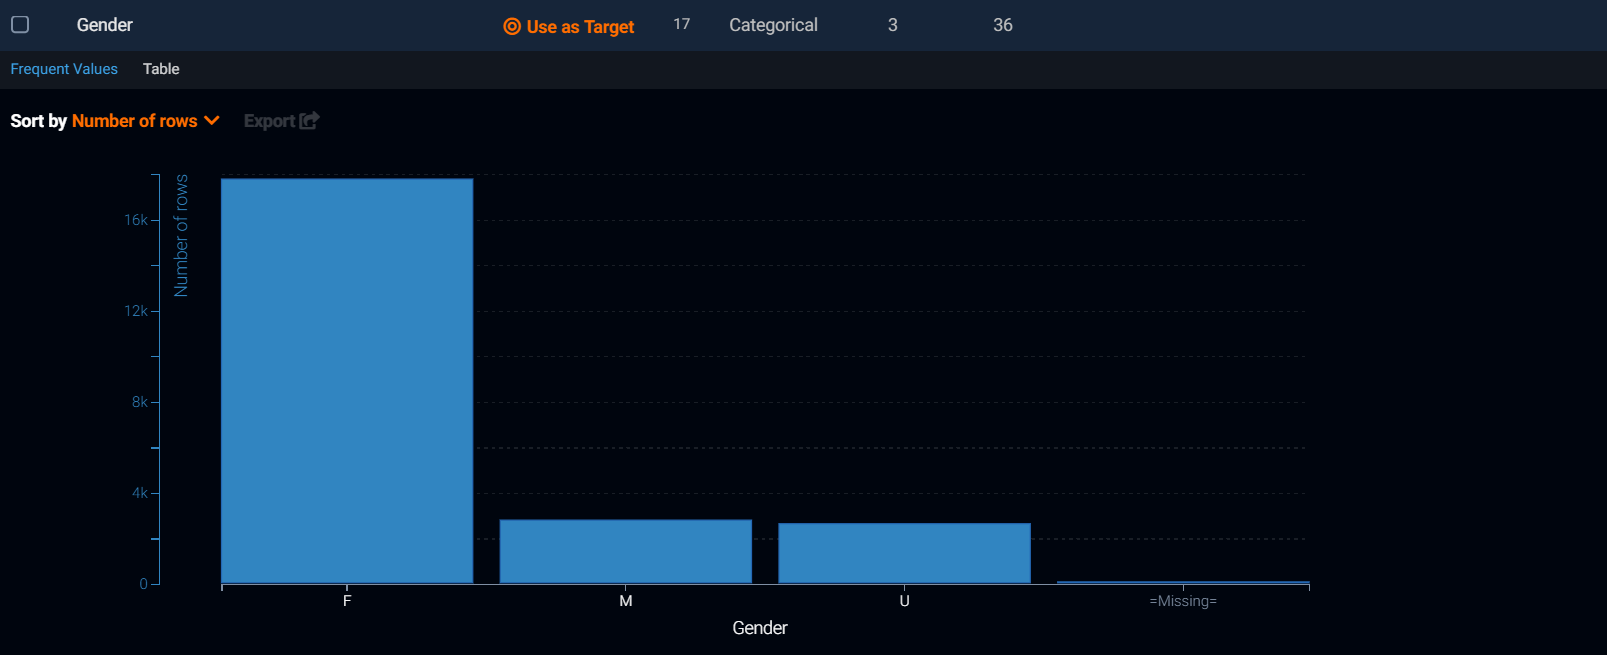
From the perspective of marketing data analytics operations, using the data exploration features can help gain a much richer and more detailed understanding of a customer dataset. It can help identify which characteristics are most likely to be strongly correlated to purchasing behavior.
By using this information, you can more closely correlate your marketing campaigns to ideal target prospects.

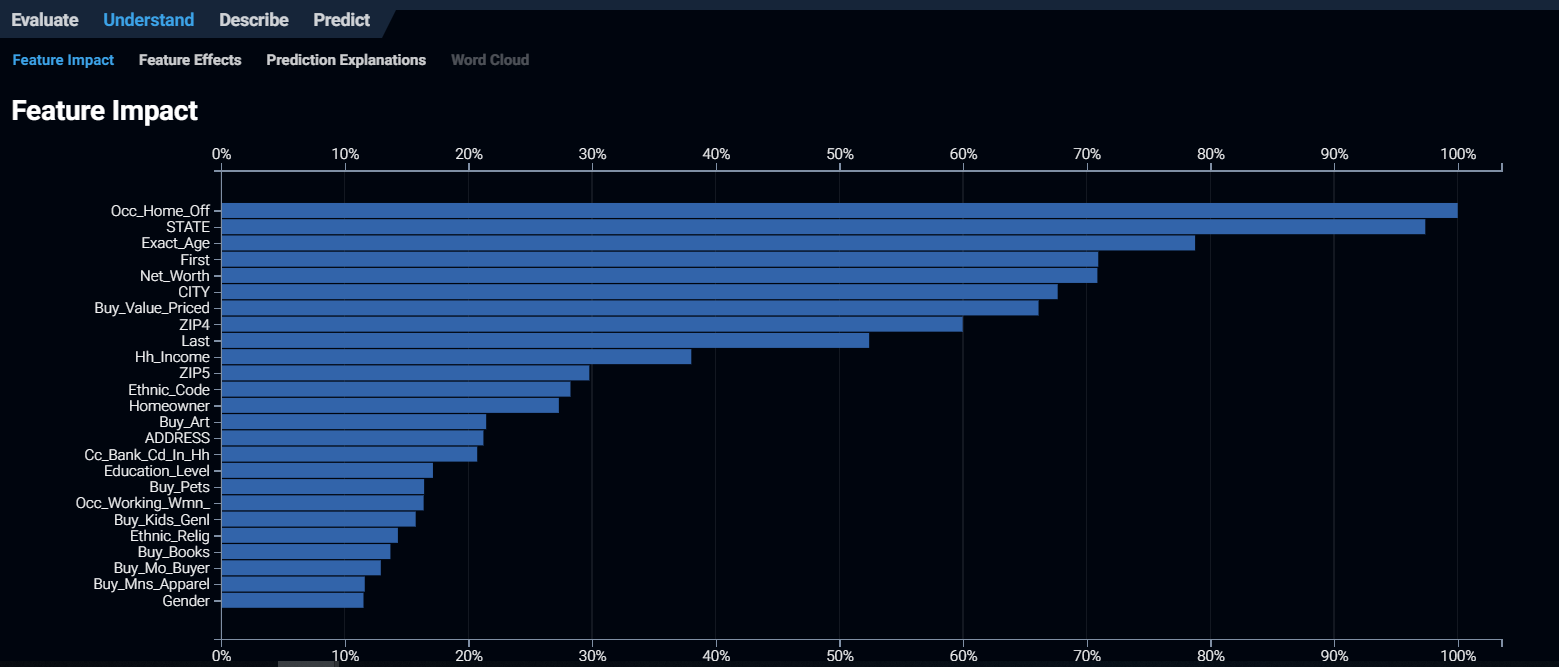
Feature Importance
Here you can see a useful visualization of which characteristics or features have the greatest impact.

As is demonstrated in some of the visualizations below, it’s possible to easily identify interactions between customer features, and to see the extent to which they have an impact on the overall customer behavior within your dataset. This information can be applied to future campaigns to maximize your ROI.


Automated Feature Engineering
When working with direct marketing datasets, it’s quite normal to have a considerable number of records with missing values in some key categories. Through ML, DataRobot can help detect and automatically populate many of these missing data points by using operations such as one-hot encoding, missing value imputation, text mining, standardization, and data partitioning.

Engine
DataRobot is one of the first automated machine learning tools with a powerful modeling engine. DataRobot makes use of a number of open source machine learning R and Python-based libraries. These include scikit-learn, H2O, TensorFlow, Vowpal Wabbit, Spark ML, and XGBoost and applies the same techniques that data scientists use, including boosting, bagging, random forests, kernel-based methods, GLM, and many others.
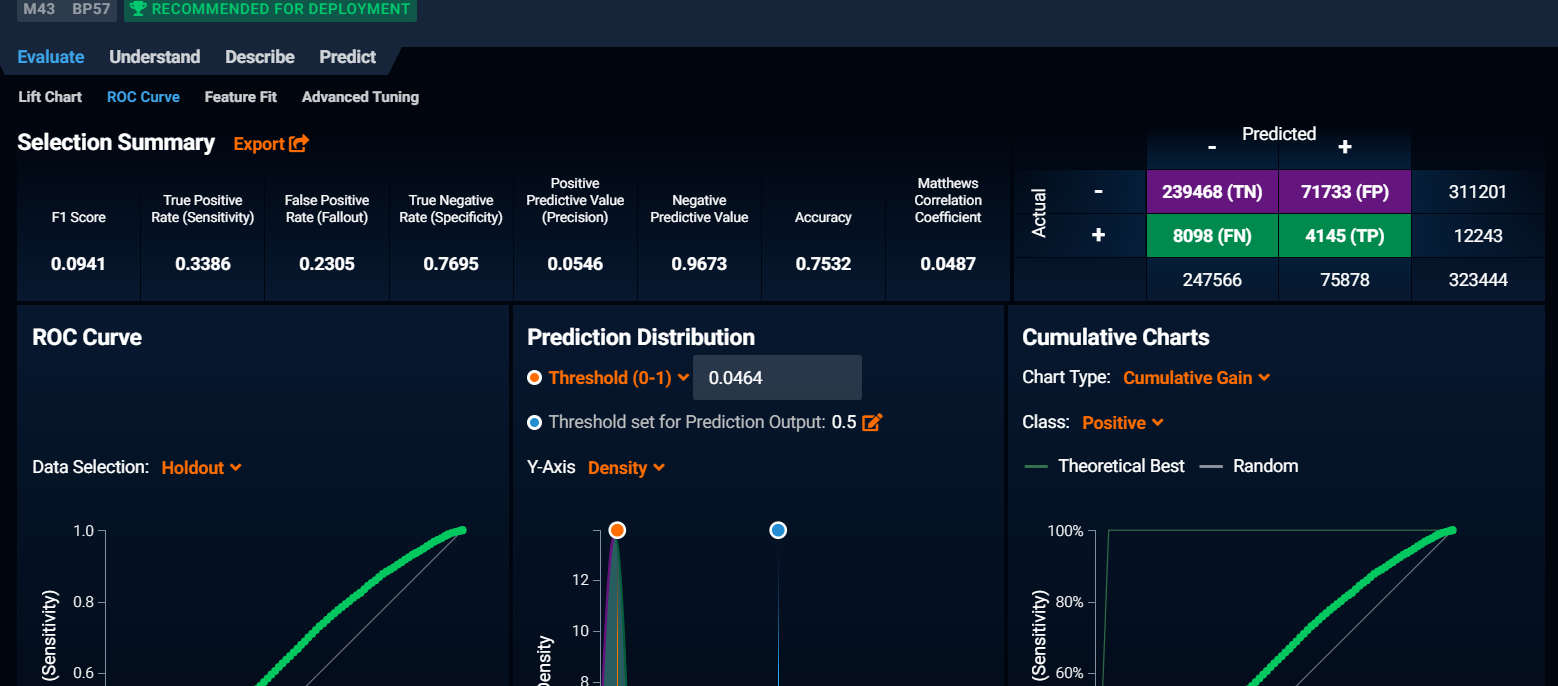
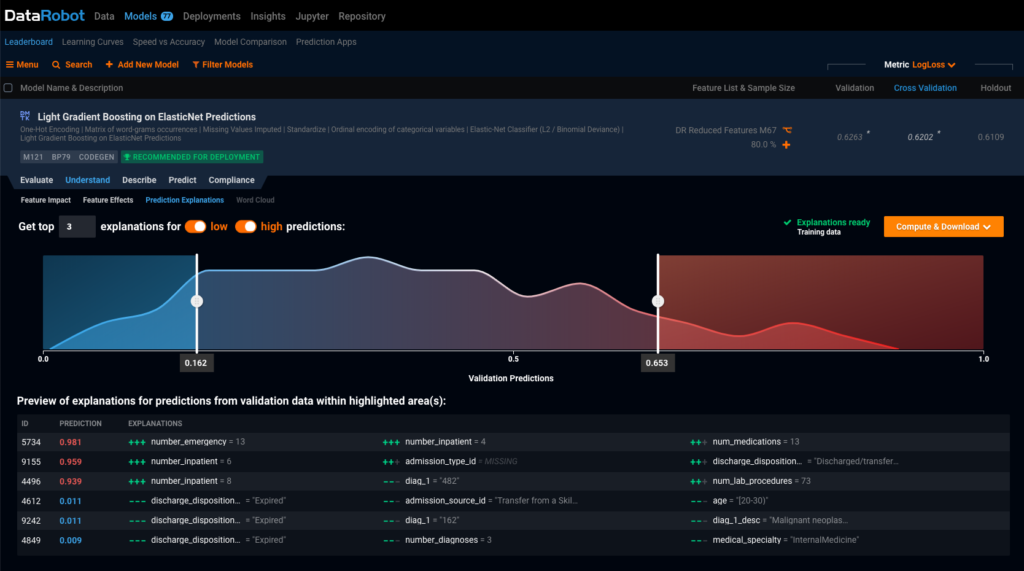
DataRobot provides a leaderboard in order to compare various models. You are able to drill down into each model to learn more details about which features it used, how much data it trained on, and its overall accuracy scores. Data Robot will create indicators showing which models are the most accurate and/or which are best suited for the deployment and you can choose the model which best suits your needs depending on different use case scenarios. For example, if you have a limited number of resources, the best model may not be the best choice if it is slow, and speed of processing is a factor. You can also select more than one.

To better understanding which model is better, DataRobot provides LIFT charts for model comparison (this can be particularly useful for marketing datasets).

Model Deployment and Management
Models built in DataRobot can be used in production immediately. You can upload your data to be evaluated and use APIs to generate predictions, and even create a few lines of code to be embedded directly into your applications.

Also, you can observe the performance of all deployed models from a central portal, and easily refresh and replace models if some model will perform better scores.


