Data visualization
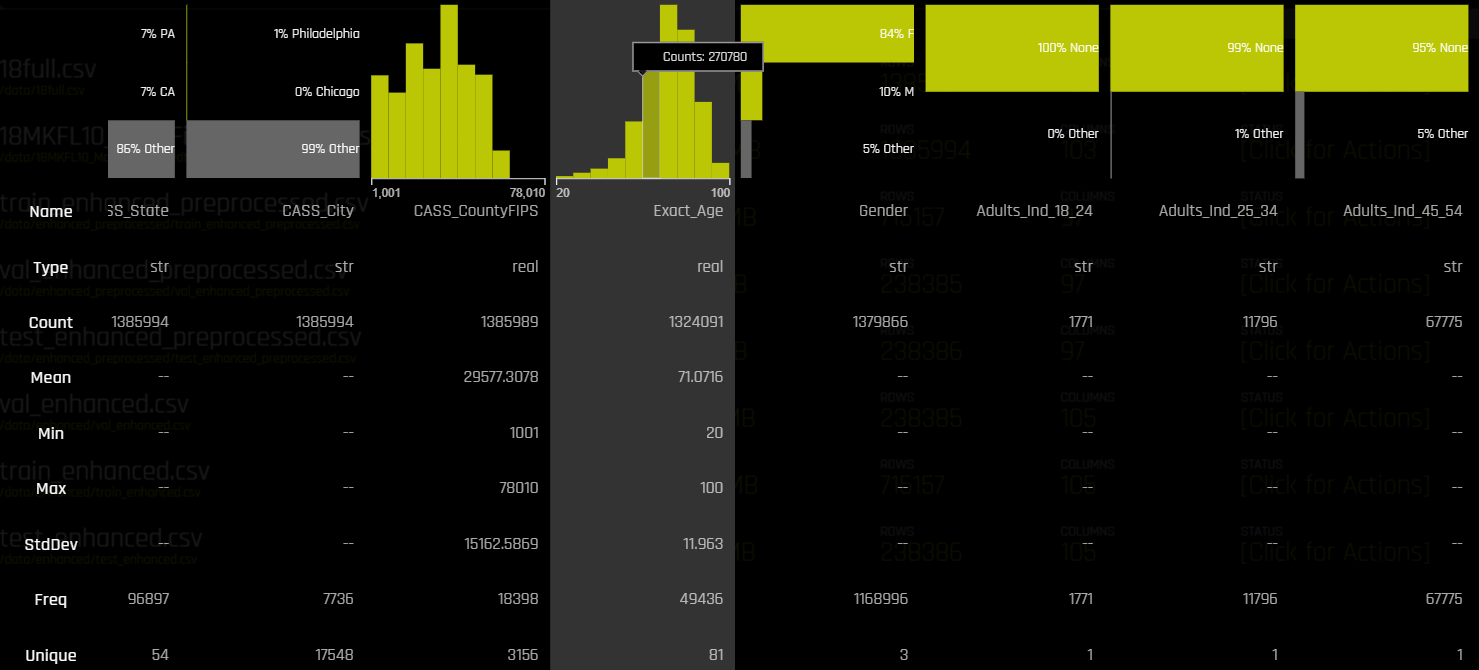
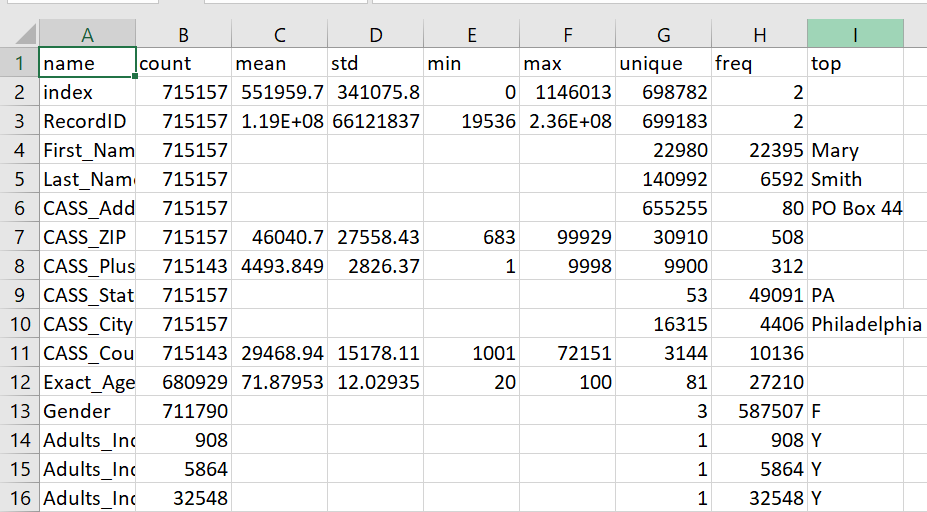
The Driverless AI implementation follows the cross-industry standard process for data mining (CRISP-DM). You are able to visualize and gain some basic understanding of your data by clicking on ‘details’. Information is provided for a number of standard factors, such standard distribution, mean, and more. This section provides you with visual overview of the dataset, such as who the clients are, what their age is, their gender, place of residence, etc.

For example, the selected column above shows that the mean age of the targeted audience is 71, with the youngest person being 20 and the oldest being 100 years old. The column to its right, Gender, shows that 84% are women and only 10% are men.
By clicking on ‘visualize,’ you can see more detailed information. For instance, looking at one of the visualizations (pictured below) you get a good understanding of negative feature distribution, or a characteristic that is missing among a data group. Other visualizations can help determine outliers, single-out distorted data, or simply better see patterns in complex datasets.
For instance, your targeting might not be as accurate if you have full columns with too much missing data, so this can help you single out the source of the problem.

You also have the option for creating more specific visualizations of the data. There is also a helpful feature which allows you to make semi-automatic predictions where parameters can be chosen with a few clicks.
Data preparation
As per the next step of CRISP, data preparation, you can also split the dataset, and divide it into a training subset, which is used for training the model, and a validation subset which is used to help detect overfitting and to assist in hyperparameter search. The testing set is used to measure the performance of the model. While Driverless AI makes it easy to split the data in a few clicks, it still requires you to think through what exactly you want to get out of this action. In the image below you can see that with the help of a slider, you can determine the exact train/valid split-ratio you require. However, before this, you need to specify the target, fold, or time columns.
For instance, the target variable can be Response Rate, and when you divide the dataset into 3 parts and train your model, it will help you better predict response rate of your audience and, subsequently, will help you better understand which part of the audience is worth targeting for the most effective results.

Data modeling
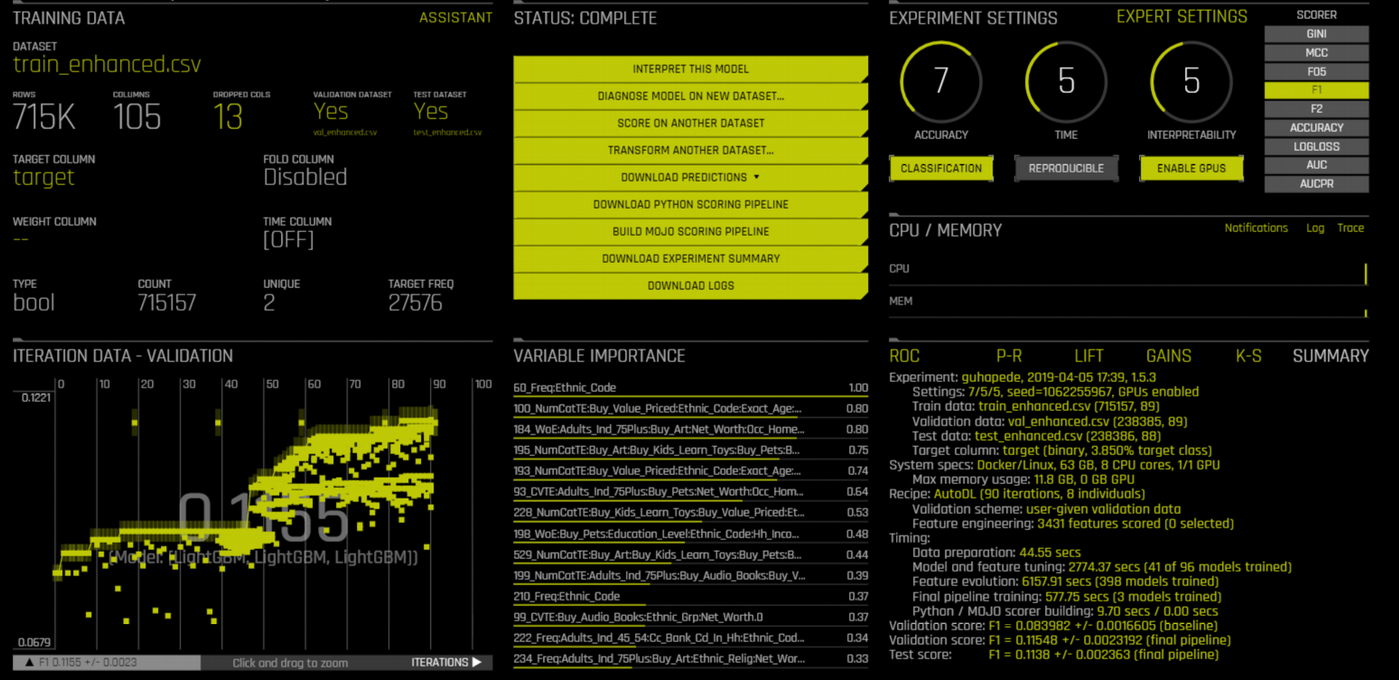
In the second tab, EXPERIMENTS, which is responsible for the modeling stage of CRISP, you are provided a detailed overview of the entire dataset, with a number of files you can download and view for the purposes of analysis. When creating an experiment, you can choose which columns to drop, what are the target and weight columns, and a specific metric (accuracy, logloss, F1, etc).
In the case of direct marketing, it is better to choose F1, due to the fact that classes are typically not balanced (usually the amount of people who did not respond is much greater than the amount of people who did, which creates some disbalance in the dataset). If we choose regular accuracy, the model can overfit and will result in a 0 score. (This is due to the fact that with direct marketing the largest data group is non-responders). For our purpose, it is far more important to be able to detect the “1” class, which represents responders.
In short, Driverless AI will help you easily deal with one of the biggest challenges in data modeling—how to deal with significant disbalance in your data.

Data interpretation
Once the experiment has been performed and the comprehensive results are displayed (see above image for reference), you can choose an option for Driverless AI to interpret those modeling results for you (as per the evaluation step of CRISP).
However, there’s plenty of information to explore on the main page. You already get information about the most important variables in your dataset, description of data set parameters, validation visualization, and experiment summary (scores, time info, CPU/GPU usage).
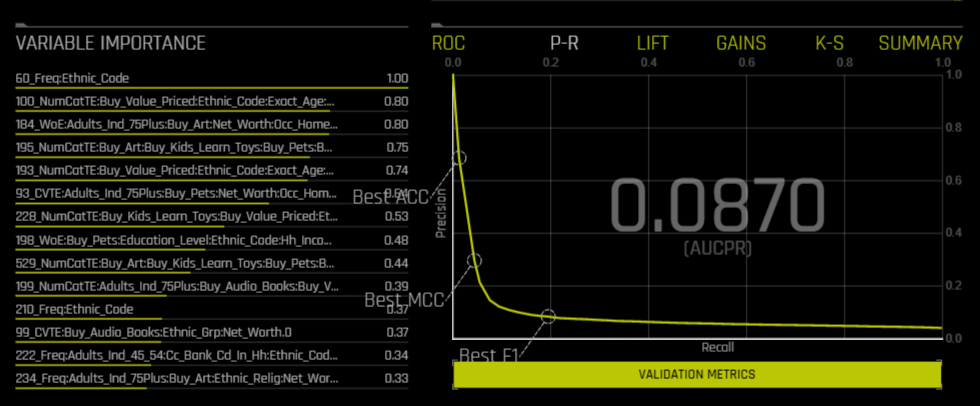
The visualizations of the ROC (receiver operating characteristic), P-R (precision-recall), LIFT, GAINS curves and the Kolmogorov–Smirnov test can help determine which percentage of the data will return the most efficient results, enabling you to get rid of bulks of data you might not necessarily need.
This is directly relevant for the purposes of direct marketing . When sending an offer to people at random, you may only get a 1% response rate. Random targeting in this manner can be inefficient and expensive. However if you can find a subset of the audience that has a better response rate, you can target only that subset in future mailings. Continuing to do this randomly can potentially lose you a percentage of responders.
Predictive modeling can help improve these response rates. By taking a sample of people, you build a model, which then assigns a score to each datum for every observation that might be relevant. By using these scores, it is possible to identify an ideal target group. With a good model, people who have a higher score are also more likely to respond to the offer in real life. The LIFT and GAINS curves will help visualize which percentage of the data will bring you best results (i.e. the higher scoring part of the target audience).
For a more comprehensive analysis, Driverless AI provides four automatically generated charts: MLI (Machine Learning Interpretability) parameters summary, DAI (Data Analytics & Intelligence) model summary, surrogate model summary, and the most important variables in the model as per the algorithm used. (These include K-LIME, Shapley, Variable Importance, Decision Tree and Partial Dependence). Experiment summary with a detailed overview of every aspect and feature of the model is downloadable, so that it is possible to try the trained model on another dataset, and download or build a scoring pipeline.
The experiment summary included in the .zip file contains many files that provide information ranging from confusion matrix, gains test results, and comprehensive model description, to train data summary and score, feature and coefficient description.
In the MLI tab, you are provided a list of already interpreted datasets. In the AUTOVIZ tab are already complete visualizations.The DIAGNOSTICS, DEPLOYMENTS AND RESOURCES tabs are generally self-explanatory.
For the deployment stage of CRISP, either a python client or a MOJO 2 runtime can be used. It is worth noting that while deploying, in order to make evaluating new campaigns more convenient, it is recommended that you export the model and make predictions locally.
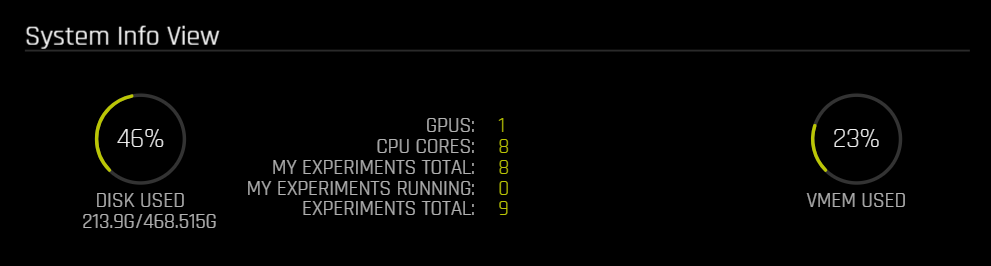
In the RESOURCES tab. you can also see information about the entire system.