Help & Support

212.660.6600

Microsoft Power BI

A review of Microsoft Power BI as a desktop and cloud-based business intelligence tool for organizations seeking to turn their data into opportunity.

4

Microsoft Power BI is a powerful but accessible desktop and cloud-based Business Intelligence tool, designed to work well with the Microsoft Office software suite. Power BI makes it relatively easy to create meaningful graphics and metrics for gaining and sharing knowledge about business trends. 

Power BI allows easy connection to a wide range of data sources. While it is designed to work best with Microsoft’s software, such as Excel, Azure SQL DB, and SharePoint, it also easily connects to many additional tools, ranging from almost any relational and non-relational database to many online web applications.

Included within its suite are some elaborate data preparation tools, making the normally time-consuming and difficult process of data modeling much simpler, using drag and drop functionality and Microsoft’s familiar Office ribbon toolbar.  It will enable ingestion, transformation, and data enrichment to import and manage multiple data sources. 

Like Microsoft’s Excel product, Power BI provides some advanced tools for data manipulation and graphing, however it also offers some sophisticated AI tools, including forecasting and clustering of datasets. 

Power BI also makes it easy to create many interactive reports just by dragging and dropping data columns into filters. These reports are responsive to user interaction and can easily be published from Power BI Desktop onto the Power BI cloud platform for easy sharing and collaboration. 

Features

Below is what Power BI looks like upon first opening it. It uses the familiar Microsoft Office-style ribbon menu, with many widgets for making manipulation of data relatively simple.

image1_27.png

Importing Data

Bringing in data from a spreadsheet, one will first get a quick preview of data to be imported. It can either be loaded immediately, or the data can be transformed using the Power Query tool.

image3_22.png

The Power Query screen helps perform most of the data cleanup and modeling typically associated with most ETL tools.

The Power Query tool is particularly useful if bringing in datasets that have been already manipulated by a human; it can eliminate various columns that are not helpful for analysis, such as totals, subtotals, etc.

The “Applied steps” can help you track your changes and see exactly what work you have done. It has other useful features, such as being able to unpivot data, to get raw results.

image2_22.png


Once the data has been imported it’s easy to examine your full dataset. 

image5_18.png

Data Visualization

Power BI makes creating data visualization by enabling straightforward creation of various attractive charts and graphs quite easy and intuitive. One simply needs to drag fields from the data set and place them into the filters on the screen, and charts begin to appear. 

image4_17.png


There are many options for visualizing data; below is an example of a pie chart:

image7_18.png

Importing from Databases

Beyond working with simple spreadsheets or CSV files, Power BI has a series of tools which allow bringing in data from entire databases for the purpose of manipulation and reporting. 

To be able to import a MySQL database required installing a new package (Power BI makes it easy to find), and then restarting the application. 

The ability to get a visual representation of the Entity Relation Model (ERM) of the database is extremely helpful.

image6_17.png


It’s worth noting that the AI within the application is able to automatically detect relationships between data in a database and any other data sources that are imported; it recognizes potentially common keys to make querying from one dataset to another easy. 

Once installed, and a database is imported, Power BI automatically recognizes relationships between tables. For instance, it is possible to get information from the client table and get a sum of net pay per client, by simply dragging the data into specified fields in the filters.

Power BI includes a number of useful filters. For instance, dates are immediately recognized, and Power BI allows filtering into several standard delineators, such as quarters. 

image9_9.png

Dashboard/Sharing

After creating several charts, these can be organized into dashboards. Power BI gives you the option to “publish” your dataset, which will then immediately link to its online cloud. Dashboards are very clear and can be interacted with by end users.  Sharing is easy; users only need to have a Power BI account (which is free for viewing; creation of dashboards the online tool requires a subscription).

image8_12.png

Advanced Analytics

Power BI also has some interesting built-in predictive features, with some natural language processing.  Using the “key influencers” widget, it can predict the effect of one indicator on another. For instance, we can determine the effect that “hours” has on “net_pay” by dragging these indicators onto the screen.

image11_5.png


There’s a built-in Q/A tool, which suggests several questions about data given the existing structures, which will then return results.  Or you can ask your own questions. 

image10_9.png


Power BI also has some more advanced tools allowing one to write scripts using Python or R to make custom predictive models. To this end, requesting assistance from professional data experts will help you get the most of Power BI. Xperra has a professional team of Data Engineers ready to provide custom solutions for each particular case.

Summary: Key Takeaway

Microsoft has created an excellent Business Intelligence tool. Power BI is well-suited for high level business users who like working with other products within the MS Office suite.  It’s easy to get working for many small projects. Power BI is good for leadership teams who want high level information, who don’t want to have to dive too deep. 

Power BI handles some of the data extraction (particularly for files) and is fairly good at some of the necessary data transformation (such as grouping and organizing data), and it also has a “loading” capability, so that you can load results of multiple merges into a database. Power BI is best to use as a final endpoint application for those dealing with more complex information. 

However, it’s not designed for some of the more advanced analytics projects. Although, it supports ETL functions, for more complex ETL processes such tools as KNIME or Alteryx perform much better.

Overall, since the Desktop version is free for use, and there is a trial for the online features, Power BI is certainly worth experimentation for many businesses who wish to be able to quickly generate some meaningful graphics out of multiple datasets.

Integrations

File data sources:

  • Excel

  • Text/CSV

  • XML

  • JSON

  • Folder

  • PDF

  • SharePoint folder


Database Data Sources

  • SQL Server database

  • Access database

  • SQL Server Analysis Services database

  • Oracle database

  • IBM DB2 database

  • IBM Informix database (Beta)

  • IBM Netezza

  • MySQL database

  • PostgreSQL database

  • Sybase database

  • Teradata database

  • SAP HANA database

  • SAP Business Warehouse Application Server

  • SAP Business Warehouse Message Server

  • Amazon Redshift

  • Impala

  • Google BigQuery

  • Vertica

  • Snowflake

  • Essbase

  • AtScale cubes

  • BI Connector Data Virtuality LDW (Beta)

  • Denodo

  • Dremio

  • Exasol

  • Indexima (Beta)

  • InterSystems IRIS (Beta)

  • Jethro (Beta)

  • Kyligence

  • MarkLogic


Azure Integrations

  • Azure SQL database

  • Azure SQL Data Warehouse

  • Azure Analysis Services database

  • Azure Blob Storage

  • Azure Table Storage

  • Azure Cosmos DB

  • Azure Data Lake Storage Gen2

  • Azure Data Lake Storage Gen1

  • Azure HDInsight (HDFS)

  • Azure HDInsight Spark

  • HDInsight Interactive Query

  • Azure Data Explorer (Kusto)

  • Azure Cost Management

  • Azure Time Series Insights (Beta)


Online data sources

  • SharePoint Online List

  • Microsoft Exchange Online

  • Dynamics 365 (online)

  • Dynamics NAV

  • Dynamics 365 Business Central

  • Dynamics 365 Business Central (on-premises)

  • Microsoft Azure Consumption Insights (Beta)

  • Azure DevOps (Beta)

  • Azure DevOps Server (Beta)

  • Salesforce Objects

  • Salesforce Reports

  • Google Analytics

  • Adobe Analytics

  • appFigures (Beta)

  • Data.World - Get Dataset (Beta)

  • GitHub (Beta)

  • LinkedIn Sales Navigator (Beta)

  • MailChimp (Beta)

  • Marketo (Beta)

  • Mixpanel (Beta)

  • Planview Enterprise One - PRM (Beta)

  • Planview Projectplace (Beta)

  • QuickBooks Online (Beta)

  • Smartsheet

  • SparkPost (Beta)

  • SweetIQ (Beta)

  • Planview Enterprise One - CTM (Beta)

  • Twilio (Beta)

  • tyGraph (Beta)

  • Webtrends (Beta)

  • Zendesk (Beta)

  • Dynamics 365 Customer Insights (Beta)

  • Emigo Data Source

  • Entersoft Business Suite (Beta)

  • FactSet Analytics (Beta)

  • Industrial App Store

  • Intune Data Warehouse (Beta)

  • Microsoft Graph Security (Beta)

  • Product Insights (Beta)

  • Quick Base

  • TeamDesk (Beta)

  • Workplace Analytics (Beta)


Other Data Sources

  • Web

  • SharePoint list

  • OData Feed

  • Active Directory

  • Microsoft Exchange

  • Hadoop File (HDFS)

  • Spark

  • R script

  • Python script

  • ODBC

  • OLE DB

  • BI360 - Budgeting & Financial Reporting (Beta)

  • FHIR

  • Information Grid (Beta)

  • Jamf Pro (Beta)

  • MicroStrategy for Power BI

  • Paxata

  • QubolePresto (Beta)

  • Roamler (Beta)

  • Siteimprove (Beta)

  • SurveyMonkey (Beta)

  • Tenforce (Smart)List (Beta)

  • Vena (Beta)

  • Workforce Dimensions (Beta)

  • Zucchetti HR Infinity (Beta)

  • Blank Query


Exporting data: 

From Desktop

  • CSV formats

  • PDF

From Power BI (online)

  • Pdf

  • Powerpoint file

  • Publish to web


Data from individual visualizations can be exported only as CSV files, using either underlying data, or summarized data.


Xperra Star Ratings

Functionality useful to a business
4 /5

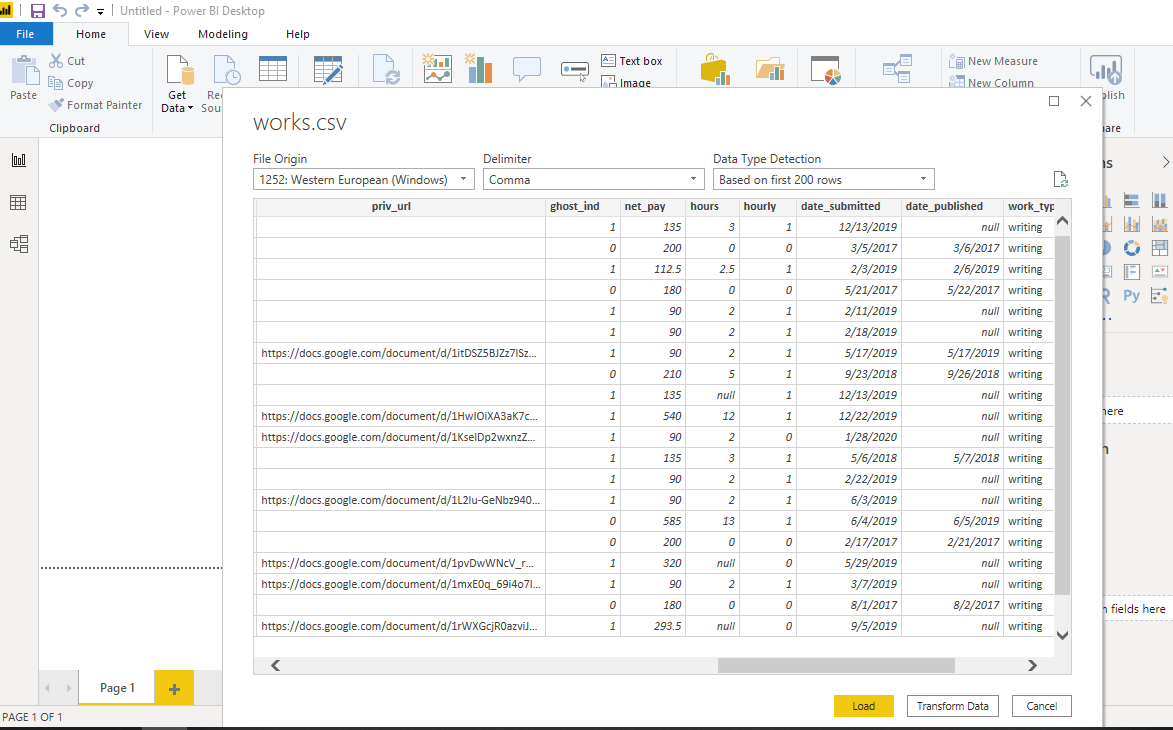
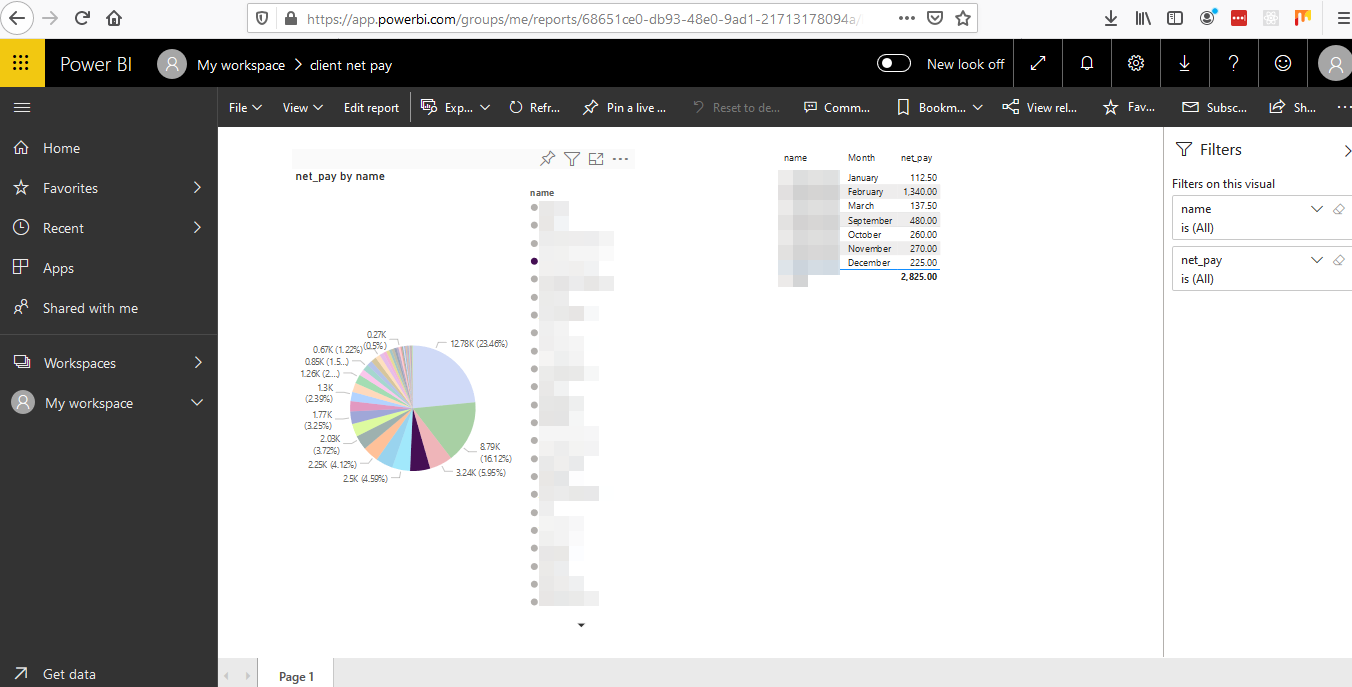
Power BI is an excellent tool for managing complex analyses of business data, and it provides the ability to automatically connect multiple data sources in a relatively short time.  It can be a useful tool for high-level business analysis. The Importing, data cleaning, graphics and dashboard creation, combined with it’s easy to use online interface make it a potentially valuable tool for many companies. Its limitations are in what it cannot do. It is not a true ETL tool, and managing and working with more complex datasets is more complicated. That’s why we suggest using Alteryx or Knime for ETL purposes. Power BI also does not allow exporting in any useful format beyond CSV or PDF, however, it allows creation of PowerPoint presentations using the online tools.

Desktop is free, however to get access to the online Power BI, which enables creating elaborate presentations, including PowerPoint templates, you will need the full version (Microsoft provides a free 60-day trial). Users can access and view reports created by someone else on the server without a pro license.  Power BI starts at a low monthly rate for smaller businesses. For large businesses, they offer a premium package which makes it possible to do Big Data Analytics, cloud and on-premise reporting, with many advanced administration and deployment tools.

Intuitive User Experience
4 /5

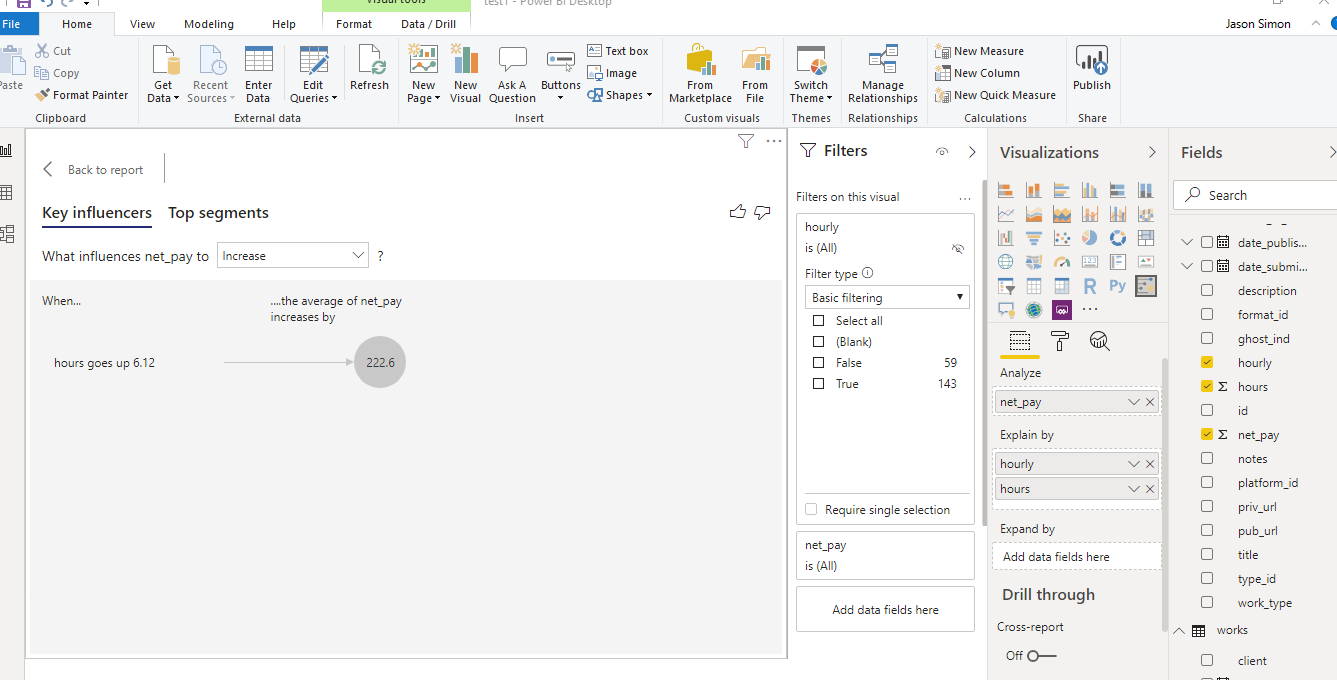
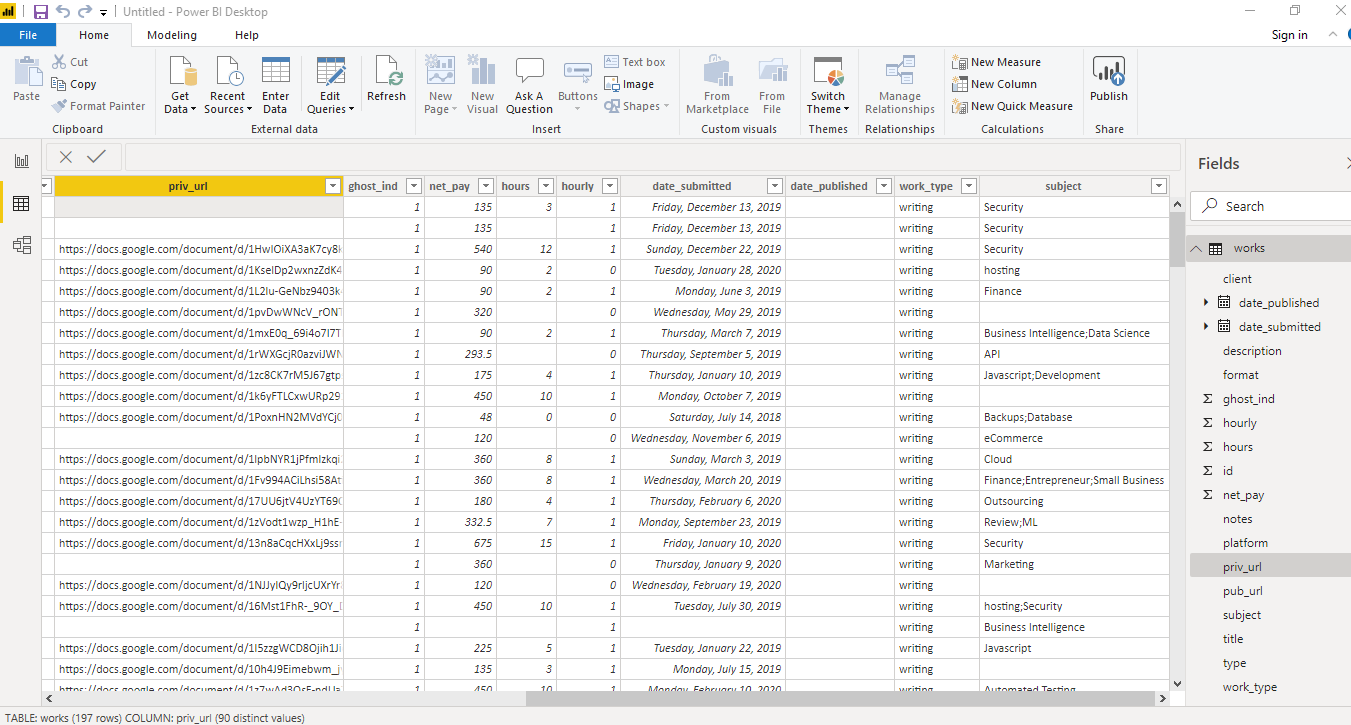
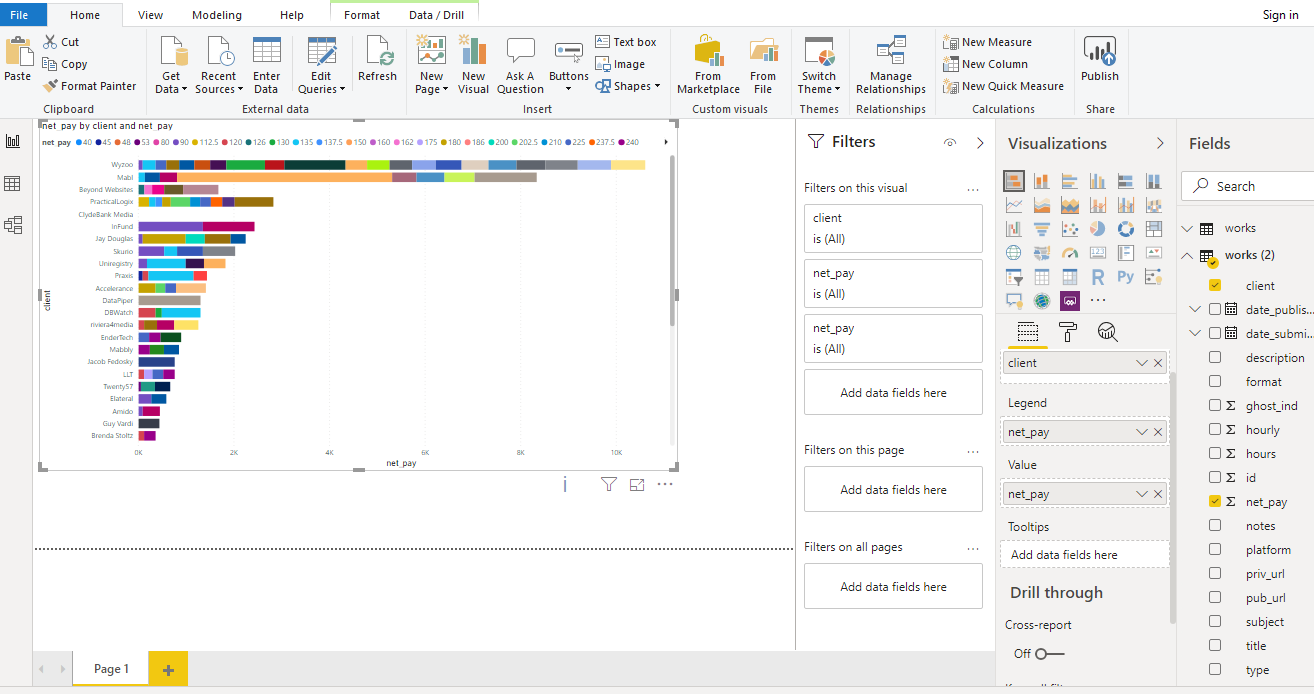
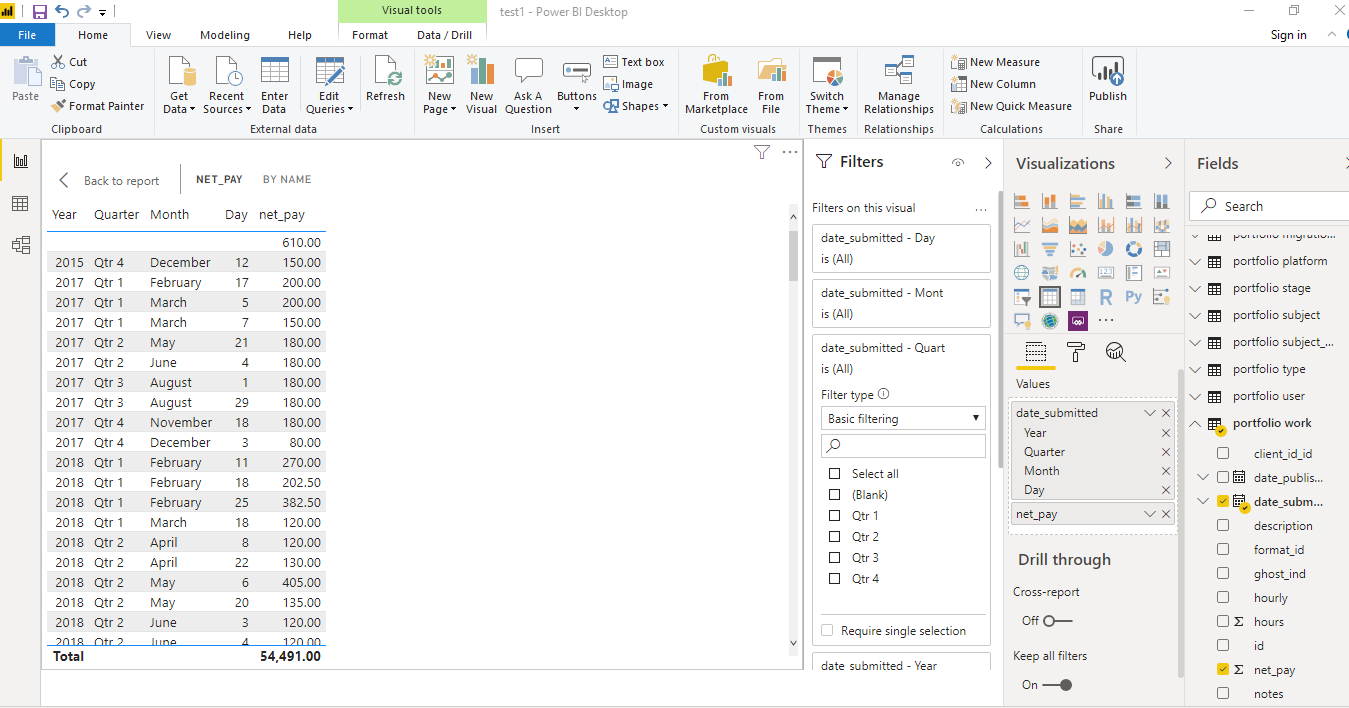
Getting started with PowerBI is relatively straightforward, and users of Microsoft Office products will find the ribbon toolbars to be familiar. However, that said, there is a bit of a learning curve in getting the product to work smoothly. Not all database extensions come pre-installed, and manipulating data requires some familiarity with the data modeling process. Creating charts also requires a little trial and error. However, once the initial confusion wears off, the process, at least for some of the most basic tasks is relatively self-explanatory. If your business needs go beyond basic Power BI features, Xperra experts are happy to assist you in taking full advantage of Power BI. 

Active Support Community
5 /5

https://community.powerbi.com/t5/Forums/ct-p/PBI_Comm_Forums

Microsoft provides some extensive support.  The forums are divided into several sections:

Desktop (including data shaping, modeling, report building): over 430,000 posts

Services (including Premium, dataflows, dashboards, reports, sharing, app.powerbi.com): approx. 80,000 posts

Report Server (on-premises – for the premium services): 11,400 posts

Power Query: (data connectivity, and preparation tool): 30,000 posts

The forum also provides categories for 

  • Mobile apps (4K posts)

  • Developer [for API usage, custom visual creation, real-time dashboards, integrations, extensions] (18K posts)

  • DAX commands (how to do things on the fly) 10K

Power BI also has several other helpful community features:

Gallery: sharing of themes, data stories, R Scripts


They also provide a series of webinars and video galleries:  https://community.powerbi.com/t5/Webinars-and-Video-Gallery/bd-p/VideoTipsTricks 

Minimal Technical Skill Required
3.5 /5

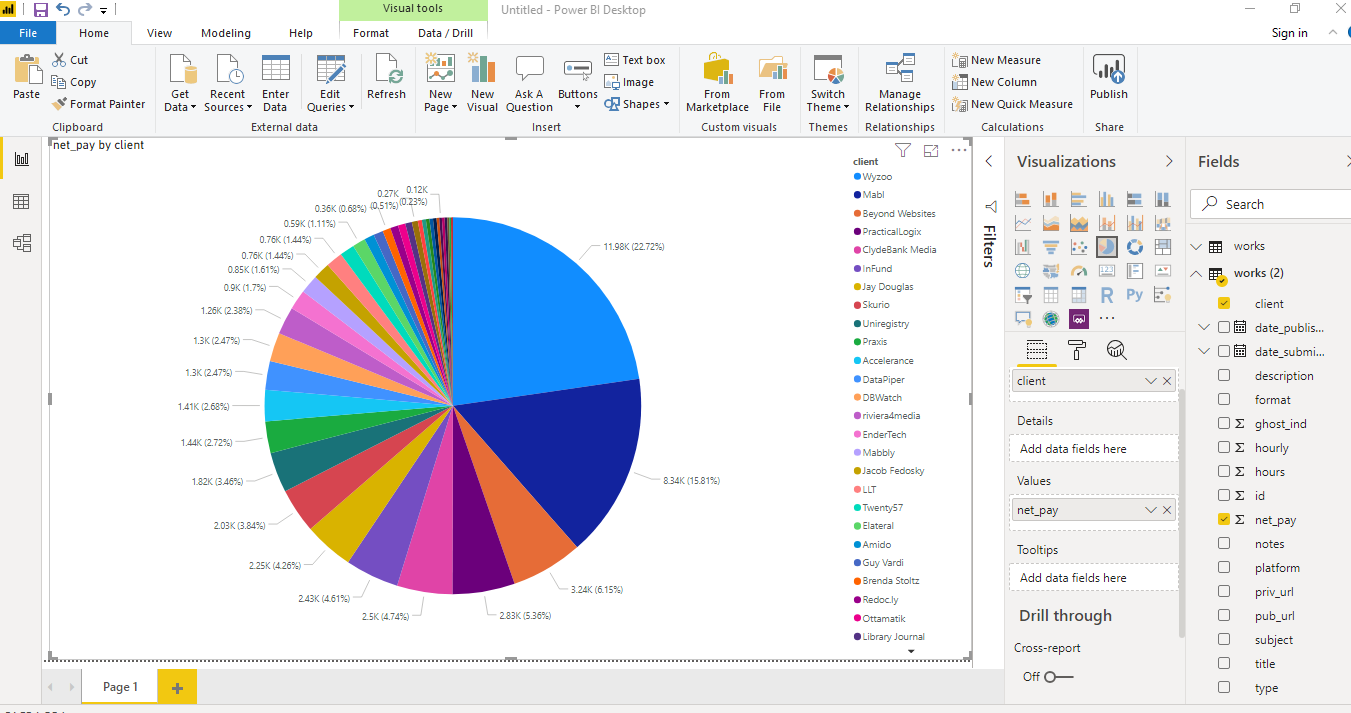
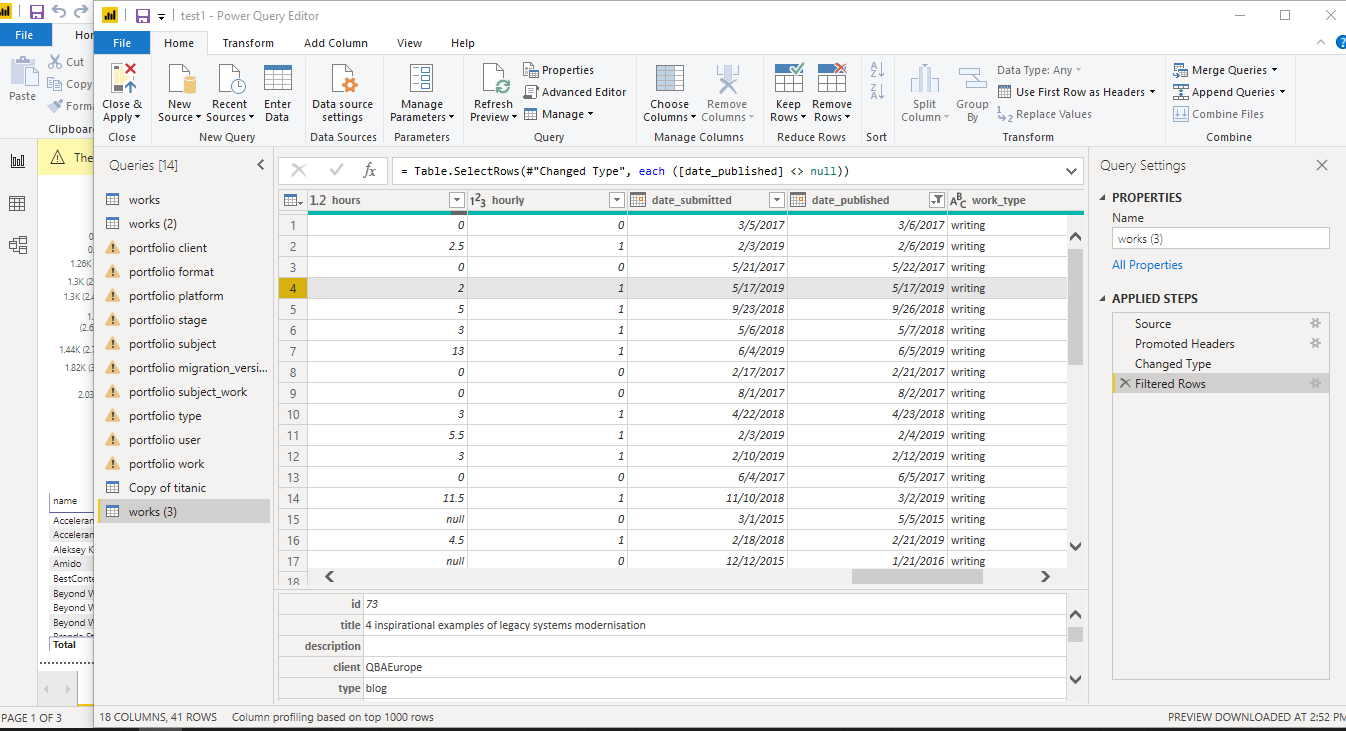
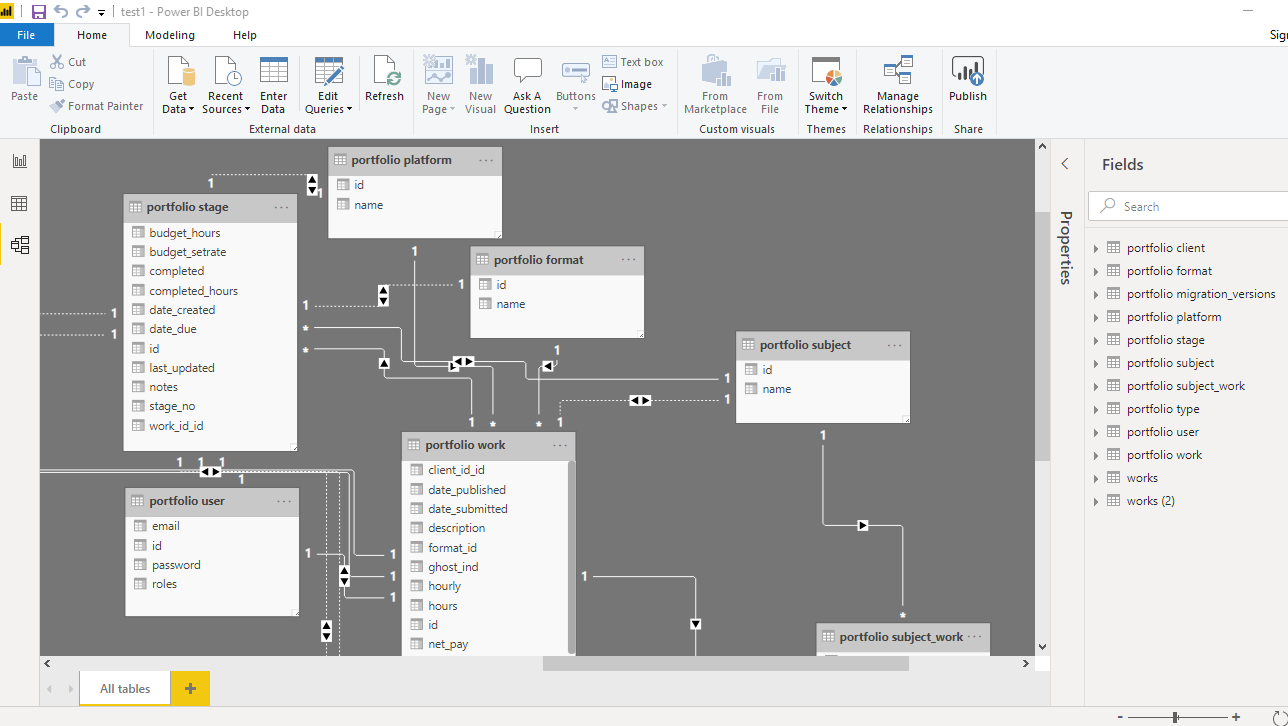
Some aspects of Power BI are quite easy to use, particularly if one is already well-versed in other Microsoft data management products such as Excel or Access. However, while data modeling is relatively straightforward in this tool, and easier than in some others, it still requires some understanding about how data itself is structured.

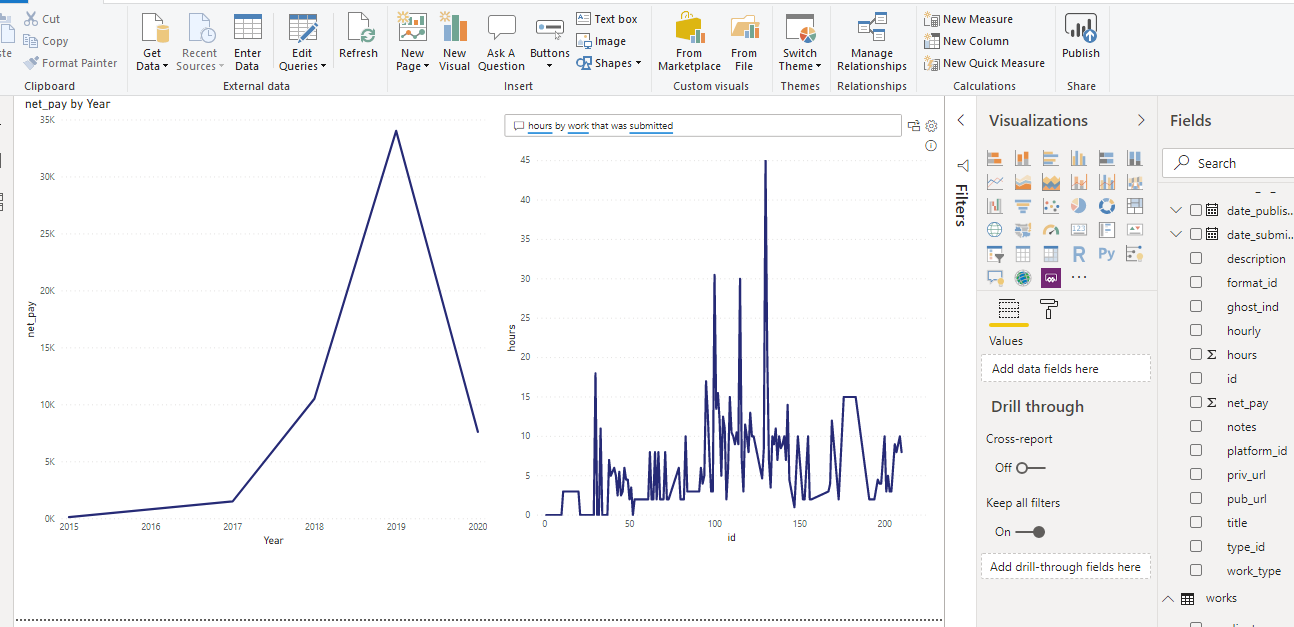
If bringing in data from databases, it does offer some easy drag and drop functionality; in fact, it handles many data joins automatically.  

Like many Microsoft products, there is a somewhat steep learning curve to be able to use some of the more advanced features. One needs to be fluent in Excel to be able to get the most use out of this tool. If one wishes to do advanced modeling, it would be helpful to know something about the Python or R programming languages.  That said, for many purposes, Power BI can be approachable for many users. If you feel that lack of data processing skills is the only thing that keeps you from picking Power BI as a perfect tool for your business tasks, we’re here to consult you on the ways to get the most of it.

Related Experts

Data Analyst

Data Analyst

Data Engineer

Data Engineer

Data Visualization Engineer

Data Visualization Engineer

Related Solutions

Better Marketing Decisions

Better Marketing Decisions

Tune Your Data For Peak Performance

Tune Your Data For Peak Performance

Gain a 360⁰ View of Your Customers

Gain a 360⁰ View of Your Customers

Other Tools

Alteryx
Data ETL & Data Wrangling Commercial

Alteryx

Alteryx is the only quick-to-implement end-to-end data analytics platform for your organization that allows data scientists and analysts alike to solve business...

KNIME Analytics Platform
Data ETL & Data Wrangling FREE Open Source

KNIME Analytics Platform

KNIME Analytics Platform is a powerful free open source data mining tool which enables data scientists to create independent applications and services through a...

Domo
Business Intelligence (Reporting and Visualization and Dashboards) Commercial

Domo

Domo is a fully cloud-based Business Intelligence tool which is designed to provide a central place for viewing and monitoring business data regardless of its p...

Zoho Analytics
Business Intelligence (Reporting and Visualization and Dashboards) Commercial

Zoho Analytics

Zoho analytics is a cloud-based, self-service business intelligence and reporting service. It allows connections from a wide range of data sources, from locally...